Confirming payment details

Payment processing
Login or Sign up
Forgot password
Enter your email address and we will send you a password reset link or need more help?
April 2015 - Hometrack UK Cities House Price Index shows homebuyers now wait up to 28 years between house moves as housing scarcity keeps upward pressure on prices
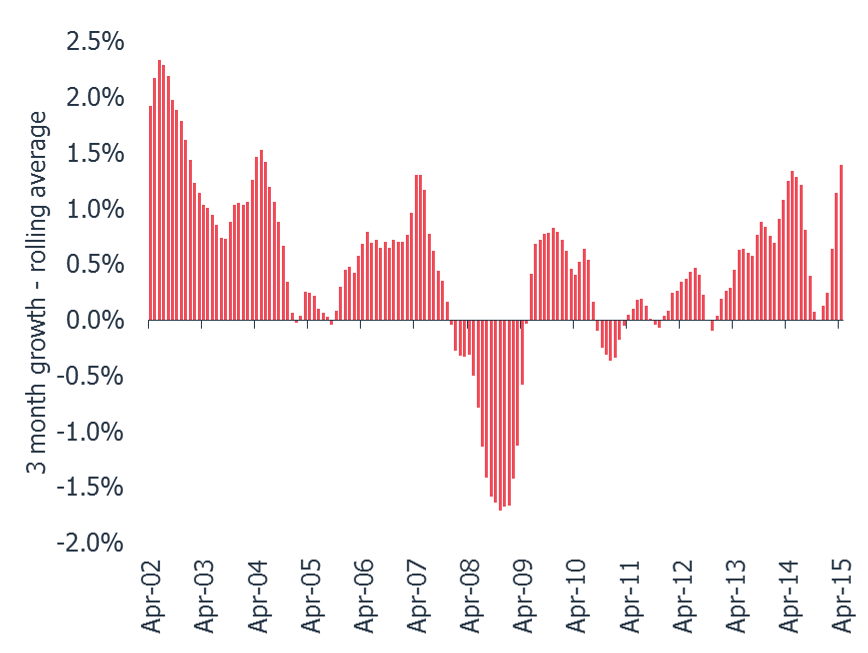
On 22 May, 2015- House prices across the Hometrack UK Cities House Price Index grew by an average of 1.4% over the three months to April - higher than the same period in 2014 (1.2%) and the highest 3 month average rate of growth for a decade
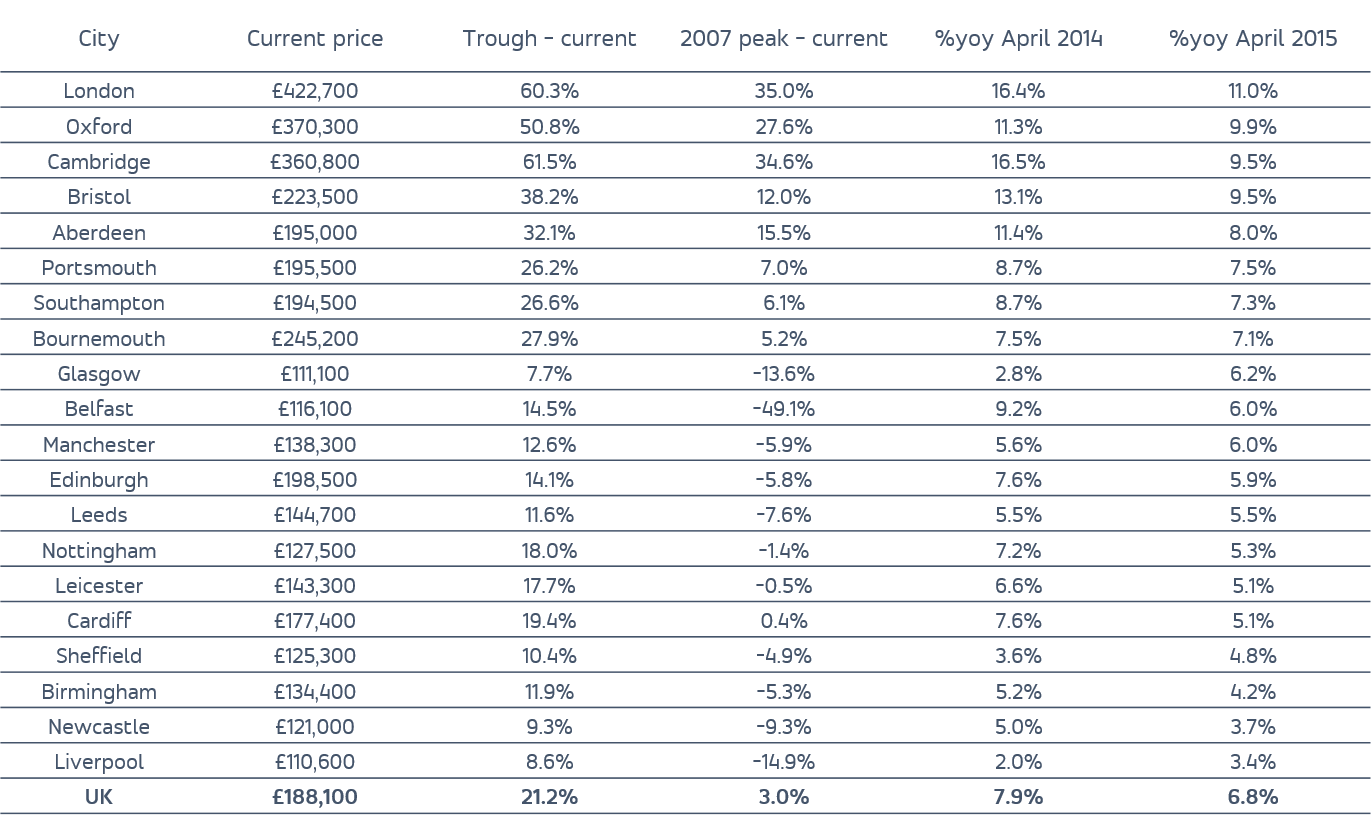
- Headline growth is being supported by house prices playing catch-up with average prices in 11 cities still below their 2007 peak with Belfast (-49.1%), Liverpool (-14.9%) and Glasgow (-13.6%) the furthest behind.
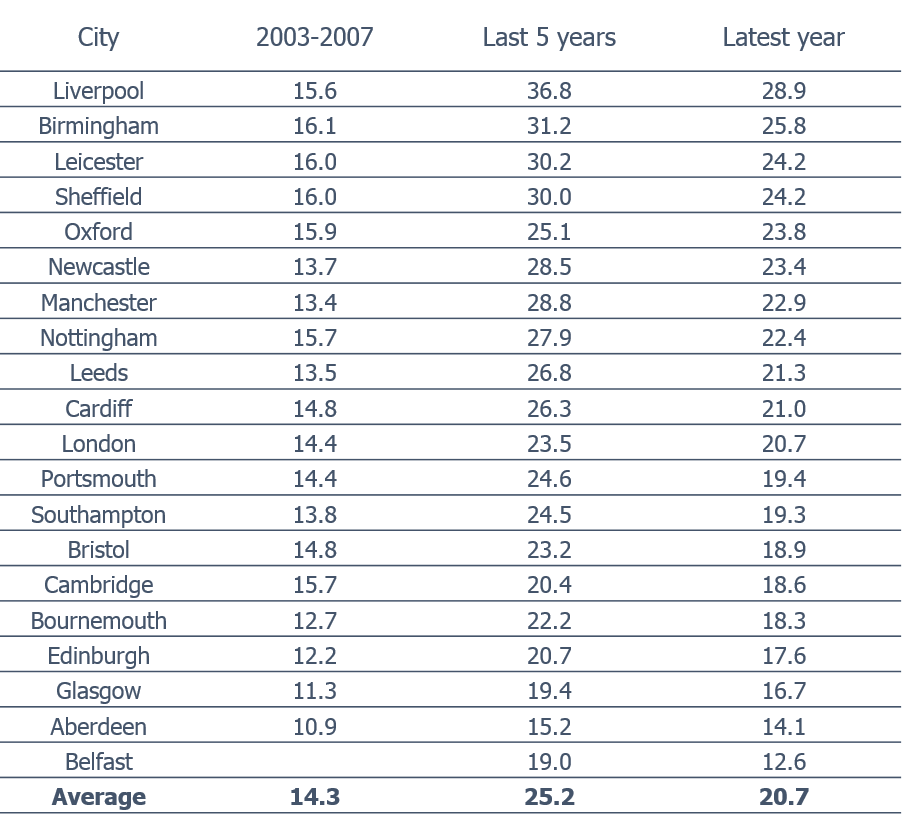
- Despite a recent pick up in housing turnover, the average time between moves in some cities is up to 28 years - twice the average between 2003 and 2007 which was a move every 14 years
- A 30% decline in the proportion of moves by existing mortgaged homeowners over the last decade is starving the market of a source of new supply and driving prices upwards.
The rate of house price inflation across UK cities has accelerated in the three months to April as record low mortgage rates support buying power and a scarcity of housing ensures prices keep on rising.
London, 22 May 2015 – The UK housing market shrugged off the uncertainty around the General Election and a sizable slowdown in the monthly rate of house price growth over the second half of 2014 to post an average increase of 1.4% over the three months to April. This is higher than the same period in 2014 (1.2%) and the biggest quarterly average rate of growth for a decade according to the Hometrack UK Cities House Price Index.
House price growth across the Hometrack UK Cities House Price Index is running at an average of 9.0% and continues to exceed the overall UK rate of growth of 6.8% year on year. At a city level the annual rate of growth ranges from 3.5% in Liverpool to 11.0% in London. This is the smallest spread in city level house prices since 1996, as the rate of growth in high value markets such as London and Cambridge moderates whilst house prices in regional cities continue to recover off a low base. However, 11 of the 20 cities have house prices that are still below their 2007 peak.
House price increases are being driven by the improving economic outlook boosting market sentiment, record low mortgage rates and a low churn of housing stock which is creating scarcity of supply.
The average number of years between moves is calculated from the number of housing sales in a year relative to the stock of private housing in each city1 .In the 1980s, the average house was changing hands every 10 years and this increased to an average of 14 years between 2003 and 2007. This has now climbed to an average of 21 years cross all cities and is as high as 28 years in some cities such as Liverpool (table 2).
Richard Donnell, Director of Research at residential analysts Hometrack, said:
“Home buyers and investors shrugged off the run up to the General Election and continued to bid up the cost of housing with average house prices across the 20 cities index up by an average of 1.4% in the 3 months to April. Record low mortgage rates, which are more than half the level of 2007, are boosting buying power, while low rates of housing turnover creates housing scarcity and is keeping an upward pressure on house prices.
One factor driving housing scarcity has been a marked decline in the proportion of housing sales by existing mortgaged homeowners – down to just 35% of all sales in 2014 - almost half the level seen in 2007. This group owns half of all owner occupied housing but fewer moves by existing mortgaged homeowners is starving the market of a source of new supply.
“Higher moving costs, and an inability or unwillingness to finance a home purchase are all factors driving fewer moves by existing homeowners. The shift to a low inflation environment also has an important longer term impact as it erodes mortgage debt more slowly than when inflation is higher. Households cannot rely on inflation to shrink their debt in real terms as much as they did in say the 1980s meaning longer periods between moves is a trend that is here to stay. Growing illiquidity of housing is a major challenge for the new Government and is set to make house prices more volatile than in the past.”
The Hometrack UK Cities House Price Index is Not Seasonally Adjusted
NOTE – The definition of London ‘City’ is larger than the London Government Region. The ‘City definition extends further out into London’s travel to work area capturing the commuter areas outside the 33 London Boroughs. The London ‘City’ area covers 44 local authorities and better represents the housing markets that are influenced by the London economy.
-ENDS-
About the Hometrack UK Cities House Price Index
The new Hometrack UK Cities House Price index has been designed to provide a granular analysis of housing market trends at a city level – cities are the focus for economic and demographic change as well as a focus for greater cross-area collaboration. The 20 cities in this new house price index cover a land area that is less than 5% of the UK but the cities contain over 40% of the value of UK housing and a similar proportion of all UK jobs. (See notes for more information on the index series.)
NOTES FOR EDITORS
1. Hometrack’s house price indices (HPI) are designed to track, as closely as possible, the performance of UK residential capital values over time. We have a track record of developing and running proprietary, localised, sub-regional house price indices for over a decade. Localised house price indices form a key part of the Hometrack automated valuation model where indexation is a key element of the valuation system. This valuation system is trusted by 4 of the top 5 lenders in the UK.
2. From October 2014, we are publishing a unique index based on 20 UK cities. We will also be producing indexes for the UK, Government Regions and the countries of Scotland, Wales and Northern Ireland. Interactive analysis, further information and FAQs on the index can be found at www.hometrack.com.
3. This new Hometrack UK Cities House Price Index is very different to our historic monthly housing survey which was an aggregation of the views of a large sample of agents and surveyors on key market trends in their local area. The survey has been dis-continued. Selected market metrics from the survey are being calculated from listings data and are available in Hometrack products and services.
4. The geographic definition of a city is based upon Primary Urban Areas – these cover the built up area of a city or a city region. Primary Urban Areas for English cities were defined in a report published by Government entitled The State of the English Cities Volume 1, ODPM, 2006. All cities are based upon amalgamations of single or multiple local authorities. The Primary Urban Area methodology has been applied to major cities across the rest of the UK covering Scotland, Wales and Northern Ireland.
5. Hometrack’s UK Cities House Price Index is created using a repeat sales based methodology drawing upon a large database comprising 100% of recorded sales prices from the Land Registry ‘Price Paid’ dataset and equivalent data from the Registers of Scotland. This price paid data is supplemented by mortgage valuation data.
6. The Hometrack UK Cities House Price Index is weighted according to the volume of private housing stock in each geographic area. The property type weightings are adjusted dynamically over time each quarter as the stock of housing grows, but the absolute changes are small.
7. The primary output of the UK Cities House Price Index build process is a monthly ‘multiplier’, the amount by which house prices have changed over the period based on the available evidence for the relevant geography. This monthly multiplier is used to create an index of house prices.
8. The Hometrack UK Cities House Price Index is revisionary i.e. there are revisions each month as more data comes available as sales are registered and further information becomes available. All UK house price indices are published on a revisionary basis. The scale of monthly revisions tends to be larger for smaller geographies where sales volumes are lower and indices can be more volatile at the leading edge. The historic revisions are minimal for the largest geographies.
9. The series are supplied on a non-seasonally adjusted basis.
10. In order to calculate the average price, the monthly price changes are applied to an average price to create a time series for average house prices from a base date which was in December 2013.
11. All average prices and percentage changes are expressed in nominal terms i.e. not adjusted for inflation.
12. Further information can be found at ww.hometrack.com
The latest Hometrack UK Cities Index reveals that in the three months to September house price inflation in London recorded the lowest quarterly growth for 20 months.
The latest Hometrack UK Cities Index reveals house price growth has fallen to 8.2% as the slowdown seen in cities across the south of England in recent months intensified in August.
London, Tuesday 13th September: Hometrack has been appointed by digital challenger bank, Atom, to provide a range of Automated Valuation Model (AVM) services.
The latest Hometrack UK Cities House Price Index reveals a marked slowdown in house price growth over the last three months, led by a deceleration in London and other high value cities across the south of England.

Subscribe to receive email updates.
HometrackGlobal:
Linked In: