Confirming payment details

Payment processing
Login or Sign up
Forgot password
Enter your email address and we will send you a password reset link or need more help?
August 2015 UK Cities Index - Gap between house prices in London and major regional cities at widest level for 20 years
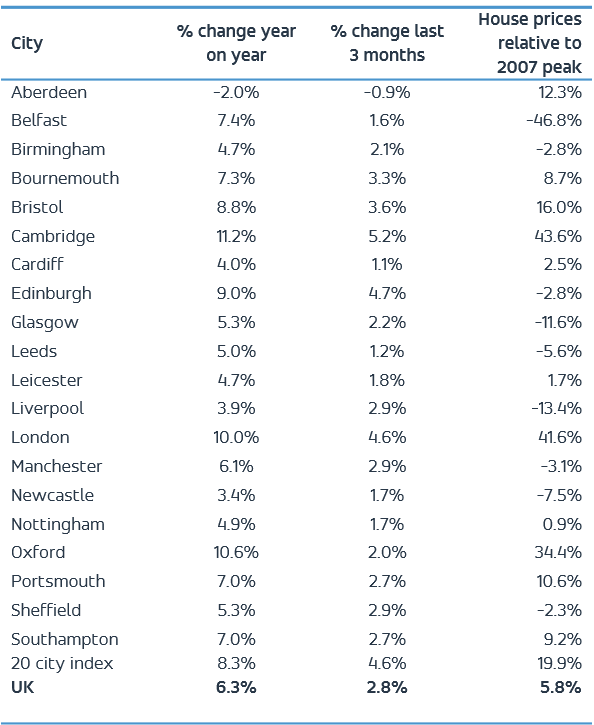
On 25 September, 2015- City level house price inflation is running at 8.3% per annum in August, up from 6.6% in May as demand for housing increases in the face of scarce supply.
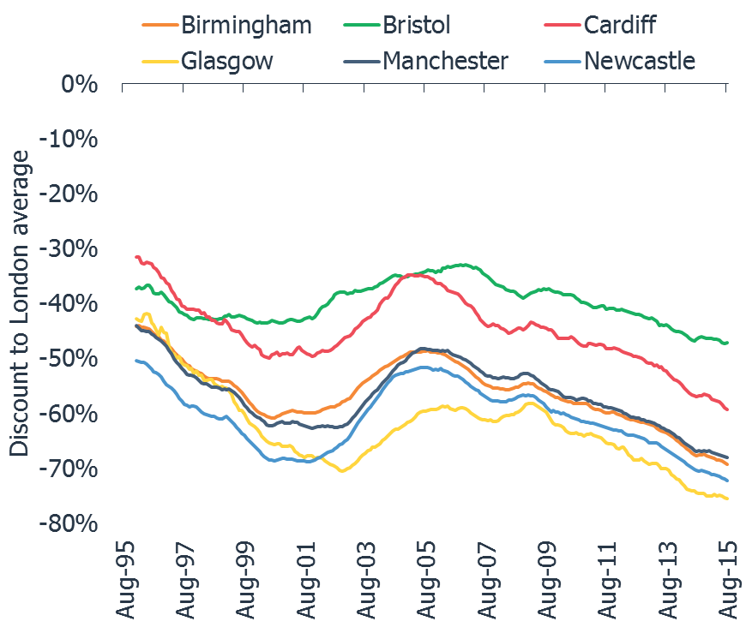
- The disparity between house prices in London and the largest regional UK cities is at its widest level for 20 years.
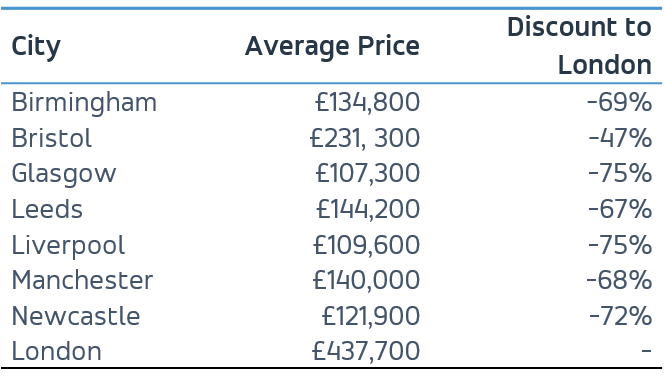
- The discount in average price from London ranges from 75% (Glasgow) to 47% (Bristol).
- The price / earnings ratio in London is over 12x times, compared to 6x in Cardiff and 4x in Glasgow.
- 50% of buyers in first half of 2015 had nothing to sell adding to the scarcity of supply and continued upward pressure on house prices.
London, 25 September 2015 – The gap between house prices in London and other major regional cities is at its widest for 20 years, according Hometrack’s UK Cities House Price Index.
Despite reports of a reduction in the gap between regional house prices, these city level figures, confirm that the slowdown in London is not happening as fast as some expected, with 4.6% growth in the three months to August and a 10% increase in the last 12 months. This is despite the ratio of average prices to earnings exceeding twelve times – a record high (figure 3).
A changing mix of buyers setting prices is compounding the upward pressure on house prices with half of purchasers in the first half of 2015 having no property to sell - this includes both first time buyers and investors buying with a mortgage or cash. The low replacement rate of stock continues to create scarcity and sustain the upward pressure on house prices.
Overall city level house price inflation is running at 8.3% up from 6.6% in May. A 38% uplift in mortgage approvals for home purchase in the last 6 months shows the scale of mortgage based demand attracted by ever lower mortgage rates. A similar expansion has been recorded in sales volumes which has translated into higher prices across UK cities.
At a city level the highest rate of growth is in Cambridge at 11.2% and lowest in Aberdeen at -2% where weakness in the oil price is impacting demand for housing. Compared to a year ago house price inflation has increased in five cities led by Edinburgh and Glasgow where growth is running at 9% and 5.3% respectively
Richard Donnell, Director of Research at residential analysts Hometrack, said:
“City level house prices continue to increase as demand for housing grows in the face of constrained supply. A changing mix of buyers is compounding the scarcity of housing for sale with rising numbers of first time buyers and investors buying property while having nothing to sell. Only a recovery in the number of moves amongst existing home owners or an increase in new supply will ease the current housing scarcity which seems unlikely in the near term.
The gap between house prices in London and other major regional cities is at its widest level for 20 years. This highlights a seemingly over-valued London market, on a price/earnings basis, and the prospect of further price growth to come in the large regional UK cities.
London’s price earnings ratio is at an all-time high while there remains value in most other regional cities. The pricing differential to London could well assist city regions attract new investment as the cost of housing starts to influence decision making for both households and businesses.”
Figure 3 Price to earnings ratio – selected cities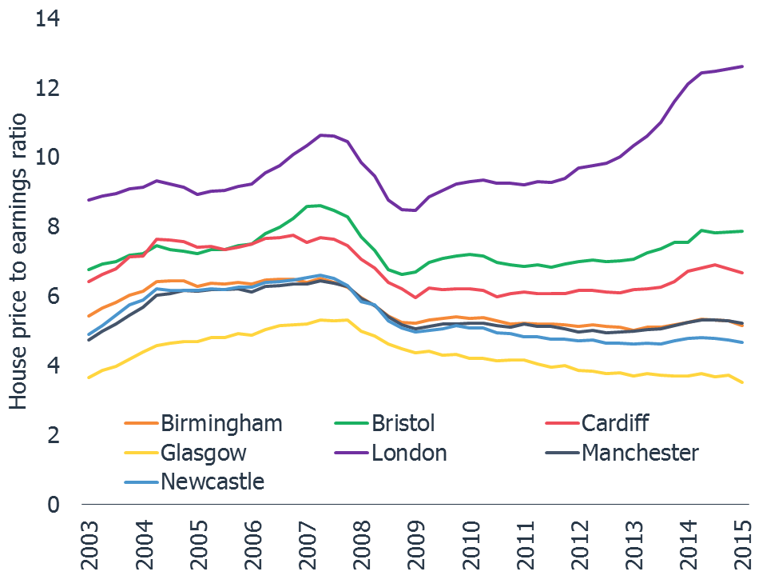
The Hometrack UK Cities House Price Index is Not Seasonally Adjusted
NOTE – The definition of London ‘City’ is larger than the London Government Region. The ‘City definition extends further out into London’s travel to work area capturing the commuter areas outside the 33 London Boroughs. The London ‘City’ area covers 44 local authorities and better represents the housing markets that are influenced by the London economy.
-ENDS-
About the Hometrack UK Cities House Price Index
The new Hometrack UK Cities House Price index has been designed to provide a granular analysis of housing market trends at a city level – cities are the focus for economic and demographic change as well as a focus for greater cross-area collaboration. The 20 cities in this new house price index cover a land area that is less than 5% of the UK but the cities contain over 40% of the value of UK housing and a similar proportion of all UK jobs. (See notes for more information on the index series.)
NOTES FOR EDITORS
1. Hometrack’s house price indices (HPI) are designed to track, as closely as possible, the performance of UK residential capital values over time. We have a track record of developing and running proprietary, localised, sub-regional house price indices for over a decade. Localised house price indices form a key part of the Hometrack automated valuation model where indexation is a key element of the valuation system. This valuation system is trusted by 4 of the top 5 lenders in the UK.
2. From October 2014, we are publishing a unique index based on 20 UK cities. We will also be producing indexes for the UK, Government Regions and the countries of Scotland, Wales and Northern Ireland. Interactive analysis, further information and FAQs on the index can be found at www.hometrack.com.
3. This new Hometrack UK Cities House Price Index is very different to our historic monthly housing survey which was an aggregation of the views of a large sample of agents and surveyors on key market trends in their local area. The survey has been dis-continued. Selected market metrics from the survey are being calculated from listings data and are available in Hometrack products and services.
4. The geographic definition of a city is based upon Primary Urban Areas – these cover the built up area of a city or a city region. Primary Urban Areas for English cities were defined in a report published by Government entitled The State of the English Cities Volume 1, ODPM, 2006. All cities are based upon amalgamations of single or multiple local authorities. The Primary Urban Area methodology has been applied to major cities across the rest of the UK covering Scotland, Wales and Northern Ireland.
5. Hometrack’s UK Cities House Price Index is created using a repeat sales based methodology drawing upon a large database comprising 100% of recorded sales prices from the Land Registry ‘Price Paid’ dataset and equivalent data from the Registers of Scotland. This price paid data is supplemented by mortgage valuation data.
6. The Hometrack UK Cities House Price Index is weighted according to the volume of private housing stock in each geographic area. The property type weightings are adjusted dynamically over time each quarter as the stock of housing grows, but the absolute changes are small.
7. The primary output of the UK Cities House Price Index build process is a monthly ‘multiplier’, the amount by which house prices have changed over the period based on the available evidence for the relevant geography. This monthly multiplier is used to create an index of house prices.
8. The Hometrack UK Cities House Price Index is revisionary i.e. there are revisions each month as more data comes available as sales are registered and further information becomes available. All UK house price indices are published on a revisionary basis. The scale of monthly revisions tends to be larger for smaller geographies where sales volumes are lower and indices can be more volatile at the leading edge. The historic revisions are minimal for the largest geographies.
9. The series are supplied on a non-seasonally adjusted basis.
10. In order to calculate the average price, the monthly price changes are applied to an average price to create a time series for average house prices from a base date which was in December 2013.
11. All average prices and percentage changes are expressed in nominal terms i.e. not adjusted for inflation.
12. Further information can be found at ww.hometrack.com
The latest Hometrack UK Cities Index reveals that in the three months to September house price inflation in London recorded the lowest quarterly growth for 20 months.
The latest Hometrack UK Cities Index reveals house price growth has fallen to 8.2% as the slowdown seen in cities across the south of England in recent months intensified in August.
London, Tuesday 13th September: Hometrack has been appointed by digital challenger bank, Atom, to provide a range of Automated Valuation Model (AVM) services.
The latest Hometrack UK Cities House Price Index reveals a marked slowdown in house price growth over the last three months, led by a deceleration in London and other high value cities across the south of England.

Subscribe to receive email updates.
HometrackGlobal:
Linked In: