Confirming payment details

Payment processing
Login or Sign up
Forgot password
Enter your email address and we will send you a password reset link or need more help?
December 2015 Hometrack UK Cities House Price Index records highest rate of house price growth since September 2014
On 22 January, 2016- Cambridge, London & Bristol post the highest annual rate of growth
- Property investors accounted for 1 in 5 of all UK house purchases in 2015
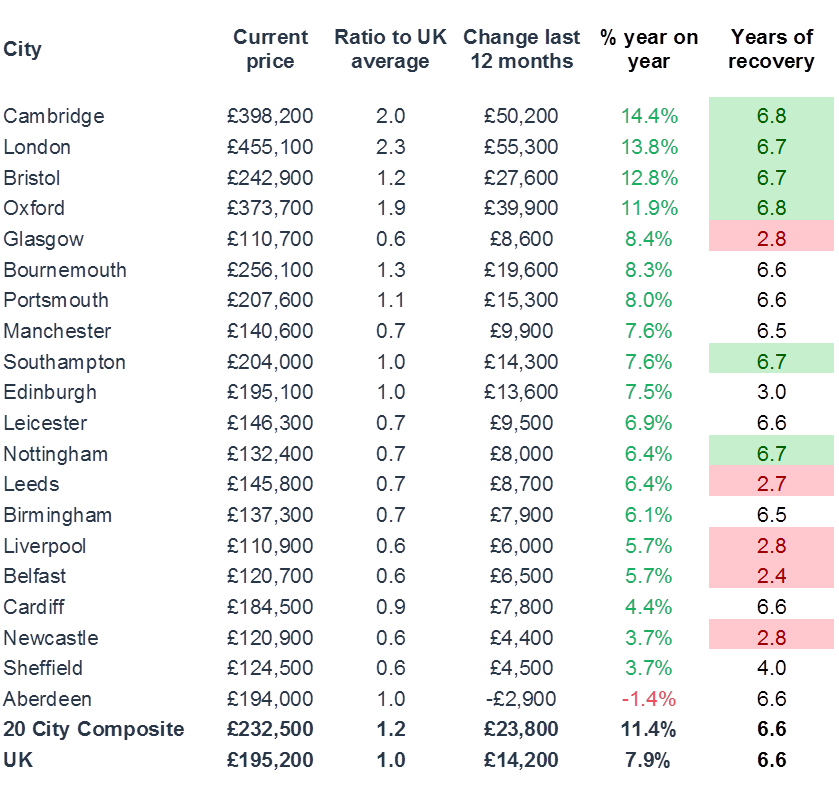
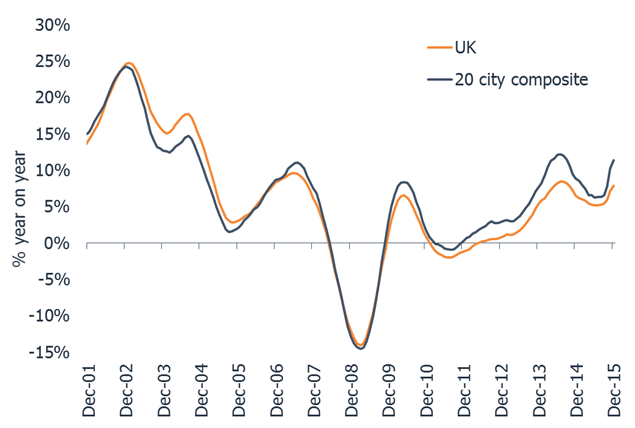
Hometrack’s UK Cities House Price Index has recorded a further jump in the rate of house price growth to 11.4%, up from 10.2% the previous month and 8.9% twelve months ago. This represents the highest rate of growth for 15 months as demand increases in the face of constrained supply not least from property investors who accounted for 1 in 5 of all buyers in 2015.
Richard Donnell, Insight Director at Hometrack says:
“With cities the focus of economic and demographic change it is no surprise that city level house price inflation continues to run ahead of UK house price growth which has also risen to 7.9%. The performance of house prices across these cities reflects the scarcity of supply and underlying demand for homes. Thirteen of the twenty cities have recorded continued growth in house prices for over 6 years with the remaining seven registering recovery in house prices between 2 and 4 years.”
Cambridge, London & Bristol post strongest annual growth
Cambridge has seen the highest annual rate of growth at 14.4% followed by London 13.8% and Bristol 12.8%. Prices may be rising but overall sales volumes across Cambridge and London look on track to be lower over 2015 as scarcity of homes for sale and affordability pressures limit overall volumes.
Meanwhile Aberdeen has seen house prices fall in the last year by 1.4% as housing demand weakens on the back of sharp drops in oil prices and the local economic impact of falling investment in oil and gas. Newcastle and Sheffield are recording the next lowest growth rates of 3.7% as prices rise slowly in cities where the housing recovery is at a much earlier stage.
Richard Donnell, Insight Director at Hometrack says:
“Looking across the 20 cities the impetus for growth continues to come from regional cities where prices are rising off a low base as household confidence improves and home owners utilise record low mortgage rates to access the market. Glasgow and Liverpool have recorded a significant increase in house price growth over the last 12 months in cities where the recovery has been running for just 2-3 years.”
Impact of rental demand and buy-to-let
A quarter of homes in the 20 cities covered by the index is private rented property and strong investor demand will explain some of the additional growth in city level house prices relative to the UK rate of growth. Property investors accounted for 1 in 5 of all UK house purchases in 2015.
Richard Donnell, Insight Director at Hometrack says:
“Much has been made of the impact of tax changes for buy to let investors with mortgaged property and the proposed new 3% stamp duty levy from April 2016. The latest Bank of England Credit Conditions Survey for 2015 Q4 suggests continued strong demand for mortgages from buy to let landlords while demand from existing home owners softened over Q4 2015. Some investors may look to move before April, we expect others will need to sell to support de-leveraging of their portfolios in order to reduce tax liabilities. This will bring much needed new supply to the market, especially for smaller sized homes.”
Donnell concludes:
“In the very near term the current momentum in house price growth looks set to translate into continued double digit price rises but we expect this to moderate as external factors start to weigh on market sentiment and affordability pressure finally catches up with high growth markets.”
The Hometrack UK Cities House Price Index is Not Seasonally Adjusted
NOTE – The definition of London ‘City’ is larger than the London Government Region. The ‘City definition extends further out into London’s travel to work area capturing the commuter areas outside the 33 London Boroughs. The London ‘City’ area covers 44 local authorities and better represents the housing markets that are influenced by the London economy.
-ENDS-
About the Hometrack UK Cities House Price Index
The new Hometrack UK Cities House Price index has been designed to provide a granular analysis of housing market trends at a city level – cities are the focus for economic and demographic change as well as a focus for greater cross-area collaboration. The 20 cities in this new house price index cover a land area that is less than 5% of the UK but the cities contain over 40% of the value of UK housing and a similar proportion of all UK jobs. (See notes for more information on the index series.)
NOTES FOR EDITORS
1. Hometrack’s house price indices (HPI) are designed to track, as closely as possible, the performance of UK residential capital values over time. We have a track record of developing and running proprietary, localised, sub-regional house price indices for over a decade. Localised house price indices form a key part of the Hometrack automated valuation model where indexation is a key element of the valuation system. This valuation system is trusted by 4 of the top 5 lenders in the UK.
2. From October 2014, we are publishing a unique index based on 20 UK cities. We will also be producing indexes for the UK, Government Regions and the countries of Scotland, Wales and Northern Ireland. Interactive analysis, further information and FAQs on the index can be found at www.hometrack.com.
3. This new Hometrack UK Cities House Price Index is very different to our historic monthly housing survey which was an aggregation of the views of a large sample of agents and surveyors on key market trends in their local area. The survey has been dis-continued. Selected market metrics from the survey are being calculated from listings data and are available in Hometrack products and services.
4. The geographic definition of a city is based upon Primary Urban Areas – these cover the built up area of a city or a city region. Primary Urban Areas for English cities were defined in a report published by Government entitled The State of the English Cities Volume 1, ODPM, 2006. All cities are based upon amalgamations of single or multiple local authorities. The Primary Urban Area methodology has been applied to major cities across the rest of the UK covering Scotland, Wales and Northern Ireland.
5. Hometrack’s UK Cities House Price Index is created using a repeat sales based methodology drawing upon a large database comprising 100% of recorded sales prices from the Land Registry ‘Price Paid’ dataset and equivalent data from the Registers of Scotland. This price paid data is supplemented by mortgage valuation data.
6. The Hometrack UK Cities House Price Index is weighted according to the volume of private housing stock in each geographic area. The property type weightings are adjusted dynamically over time each quarter as the stock of housing grows, but the absolute changes are small.
7. The primary output of the UK Cities House Price Index build process is a monthly ‘multiplier’, the amount by which house prices have changed over the period based on the available evidence for the relevant geography. This monthly multiplier is used to create an index of house prices.
8. The Hometrack UK Cities House Price Index is revisionary i.e. there are revisions each month as more data comes available as sales are registered and further information becomes available. All UK house price indices are published on a revisionary basis. The scale of monthly revisions tends to be larger for smaller geographies where sales volumes are lower and indices can be more volatile at the leading edge. The historic revisions are minimal for the largest geographies.
9. The series are supplied on a non-seasonally adjusted basis.
10. In order to calculate the average price, the monthly price changes are applied to an average price to create a time series for average house prices from a base date which was in December 2013.
11. All average prices and percentage changes are expressed in nominal terms i.e. not adjusted for inflation.
12. Further information can be found at ww.hometrack.com
The latest Hometrack UK Cities Index reveals that in the three months to September house price inflation in London recorded the lowest quarterly growth for 20 months.
The latest Hometrack UK Cities Index reveals house price growth has fallen to 8.2% as the slowdown seen in cities across the south of England in recent months intensified in August.
London, Tuesday 13th September: Hometrack has been appointed by digital challenger bank, Atom, to provide a range of Automated Valuation Model (AVM) services.
The latest Hometrack UK Cities House Price Index reveals a marked slowdown in house price growth over the last three months, led by a deceleration in London and other high value cities across the south of England.

Subscribe to receive email updates.
HometrackGlobal:
Linked In: