Confirming payment details

Payment processing
Login or Sign up
Forgot password
Enter your email address and we will send you a password reset link or need more help?
February 2015 - Hometrack UK Cities House Price Index release
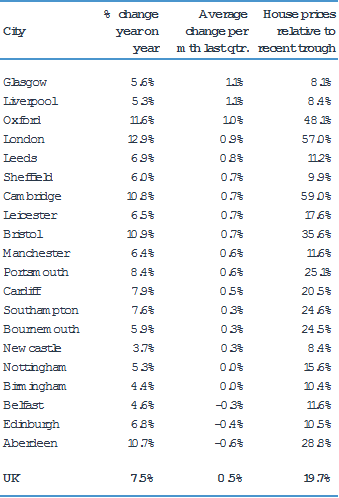
On 27 March, 2015- House price inflation across UK Cities slowed to 10% in February year on year, down from a recent high of 11.6% six months ago.
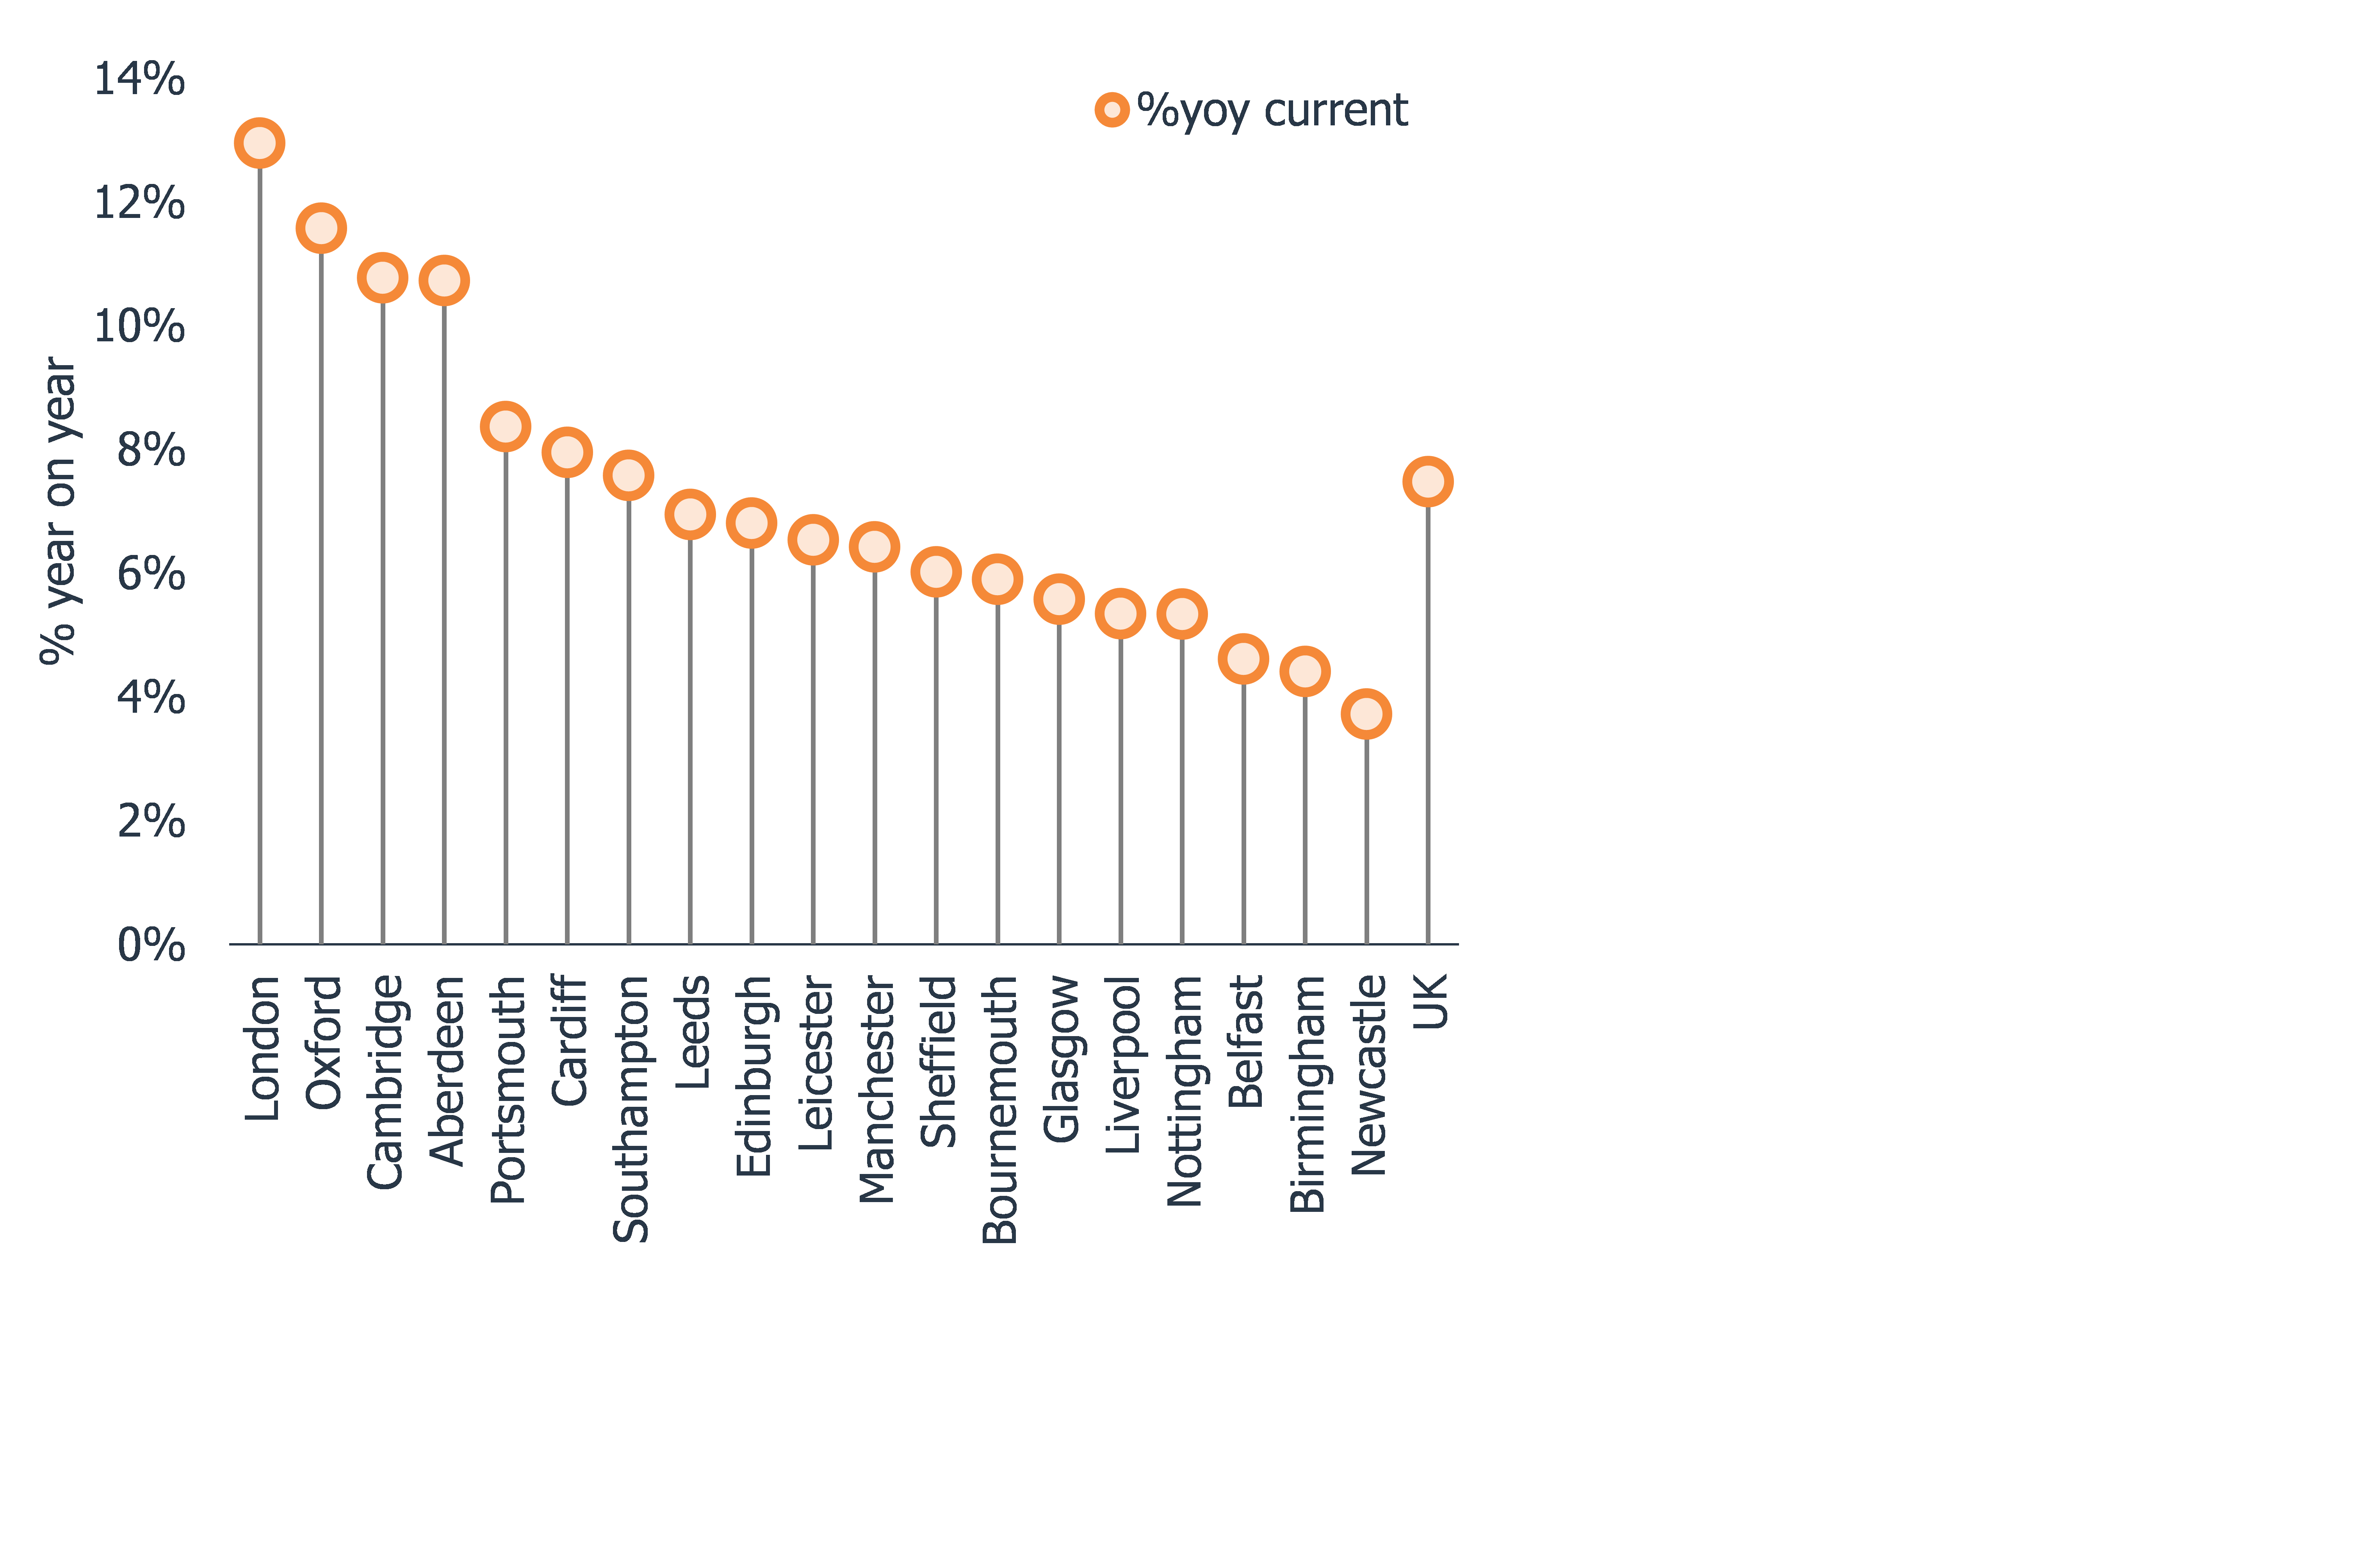
- City level house price inflation ranged from 3.7% in Newcastle to 12.9% in London year on year.
- The highest growth cities in the last quarter were Glasgow and Liverpool, where average values remain 13% and 15% below their 2007 peak.
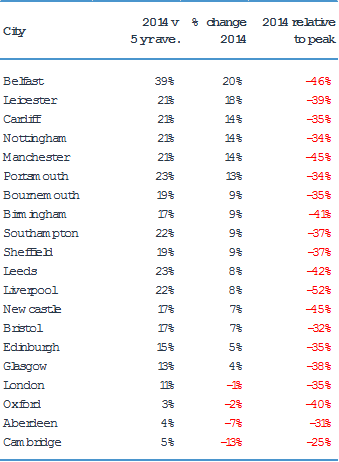
- Transaction volumes in 2014 have increased by as much as 35% in cities outside southern England as housing demand grows on the improving economic outlook.
Residential sales volumes increase by over a third in cities outside southern England while affordability hits price growth in high value cities
London, 27 March 2015 – Hometrack’s UK Cities House Price Index reveals that the rate of house price inflation continues to slow with growth of 10% in the 12 months to February compared to 11.6% six months ago. House price growth ranges from 3.6% in Newcastle to 12.9% in London.
While house price growth in high value cities such as London, Oxford and Cambridge continues to slow, lower value cities registered a sharp uplift in transaction volumes in 2014 as demand for housing grows, which suggests there is substance to the recent pick-up in house price growth.
Rising transaction volumes are an important precursor to house price inflation. The 15% to 35% uplift in transactions in 2014 indicates the most significant recovery in house market activity in cities outside of the South East of England since 2007.
Belfast, Leeds, Liverpool and Cardiff all registered a 20% to 39% growth in sales volumes in 2014 compared to the average for the previous five years. Rising demand and increased market activity have resulted in increased house price inflation, which is running at between 5% and 8%.
In contrast, double digit house price to earnings ratios in the higher value cities in the South East of England are impacting demand. Growth in housing transactions in 2014 compared to their five year average was well below average. Sales volumes fell in all the high growth cities over 2014 compared to 2013, specifically -13% in Cambridge, -7% in Aberdeen, -2% in Oxford and -1% in London. Lower sales volumes are feeding into a slower rate of house price growth in these cities.
Falling sales volumes combined with a general slowdown in activity in the run up to the General Election are resulting in lower mortgage approvals for home purchase. Home owners using a mortgage to buy a home accounted for two thirds of sales in 2014 according to analysis by Hometrack. The remaining third of sales were to cash buyers or those borrowing with a buy-to-let mortgage – groups who are not subject to mortgage affordability tests. The Hometrack UK Cities index includes sales to mortgaged home owners, investors and cash buyers.
Richard Donnell, Director of Research at residential analysts Hometrack, said: “Transactions are a lead indicator for house prices. The acceleration in house price growth in London in the last two years was preceded by three years of rising transactions. A similar pattern is being registered in the cities outside the south of England, as pent-up demand returns to the market supported by low mortgage rates and an improving economic outlook.
“While the pick-up in activity is welcome news, housing sales in 2014 are still 38% lower than the level seen in 2007 and 10% below the average for the last decade.
“The ongoing housing recovery is far from broad based and remains focused on higher value areas within cities where households have equity and find it easier to access mortgage finance.”
The Hometrack UK Cities House Price Index is Not Seasonally Adjusted
NOTE – The definition of London ‘City’ is larger than the London Government Region. The ‘City definition extends further out into London’s travel to work area capturing the commuter areas outside the 33 London Boroughs. The London ‘City’ area covers 44 local authorities and better represents the housing markets that are influenced by the London economy.
-ENDS-
About the Hometrack UK Cities House Price Index
The new Hometrack UK Cities House Price index has been designed to provide a granular analysis of housing market trends at a city level – cities are the focus for economic and demographic change as well as a focus for greater cross-area collaboration. The 20 cities in this new house price index cover a land area that is less than 5% of the UK but the cities contain over 40% of the value of UK housing and a similar proportion of all UK jobs. (See notes for more information on the index series.)
NOTES FOR EDITORS
1. Hometrack’s house price indices (HPI) are designed to track, as closely as possible, the performance of UK residential capital values over time. We have a track record of developing and running proprietary, localised, sub-regional house price indices for over a decade. Localised house price indices form a key part of the Hometrack automated valuation model where indexation is a key element of the valuation system. This valuation system is trusted by 4 of the top 5 lenders in the UK.
2. From October 2014, we are publishing a unique index based on 20 UK cities. We will also be producing indexes for the UK, Government Regions and the countries of Scotland, Wales and Northern Ireland. Interactive analysis, further information and FAQs on the index can be found at www.hometrack.com.
3. This new Hometrack UK Cities House Price Index is very different to our historic monthly housing survey which was an aggregation of the views of a large sample of agents and surveyors on key market trends in their local area. The survey has been dis-continued. Selected market metrics from the survey are being calculated from listings data and are available in Hometrack products and services.
4. The geographic definition of a city is based upon Primary Urban Areas – these cover the built up area of a city or a city region. Primary Urban Areas for English cities were defined in a report published by Government entitled The State of the English Cities Volume 1, ODPM, 2006. All cities are based upon amalgamations of single or multiple local authorities. The Primary Urban Area methodology has been applied to major cities across the rest of the UK covering Scotland, Wales and Northern Ireland.
5. Hometrack’s UK Cities House Price Index is created using a repeat sales based methodology drawing upon a large database comprising 100% of recorded sales prices from the Land Registry ‘Price Paid’ dataset and equivalent data from the Registers of Scotland. This price paid data is supplemented by mortgage valuation data.
6. The Hometrack UK Cities House Price Index is weighted according to the volume of private housing stock in each geographic area. The property type weightings are adjusted dynamically over time each quarter as the stock of housing grows, but the absolute changes are small.
7. The primary output of the UK Cities House Price Index build process is a monthly ‘multiplier’, the amount by which house prices have changed over the period based on the available evidence for the relevant geography. This monthly multiplier is used to create an index of house prices.
8. The Hometrack UK Cities House Price Index is revisionary i.e. there are revisions each month as more data comes available as sales are registered and further information becomes available. All UK house price indices are published on a revisionary basis. The scale of monthly revisions tends to be larger for smaller geographies where sales volumes are lower and indices can be more volatile at the leading edge. The historic revisions are minimal for the largest geographies.
9. The series are supplied on a non-seasonally adjusted basis.
10. In order to calculate the average price, the monthly price changes are applied to an average price to create a time series for average house prices from a base date which was in December 2013.
11. All average prices and percentage changes are expressed in nominal terms i.e. not adjusted for inflation.
12. Further information can be found at ww.hometrack.com
The latest Hometrack UK Cities Index reveals that in the three months to September house price inflation in London recorded the lowest quarterly growth for 20 months.
The latest Hometrack UK Cities Index reveals house price growth has fallen to 8.2% as the slowdown seen in cities across the south of England in recent months intensified in August.
London, Tuesday 13th September: Hometrack has been appointed by digital challenger bank, Atom, to provide a range of Automated Valuation Model (AVM) services.
The latest Hometrack UK Cities House Price Index reveals a marked slowdown in house price growth over the last three months, led by a deceleration in London and other high value cities across the south of England.

Subscribe to receive email updates.
HometrackGlobal:
Linked In: