Confirming payment details

Payment processing
Login or Sign up
Forgot password
Enter your email address and we will send you a password reset link or need more help?
July 2015 UK Cities Index shows city level house prices registering the highest quarterly growth for the last 11 years
On 21 August, 2015- House prices up 4.3% in three months to July 2015 - highest quarterly growth for 11 years
- House price inflation has increased from 7.2% in April to 8.5% in July
- A new cluster of cities such as Bristol (8.6%), Edinburgh (8%), and Southampton (7.1%) snap at the heels of year on year house price growth in London (9.4%), Oxford (9.8%) and Cambridge (10.9%)
- Liverpool (-13.2%) and Glasgow (-11.2%) remain well below their former 2007 peak
- All cities except Aberdeen are registering house price growth that outperforms the increase in average earnings (currently 2.4%)
House prices are up by 4.3% over the last three months outstripping the 2.4% annual growth in average earnings… and there is room for further growth as nine of the twenty cities still have average prices that are lower than their 2007 peak
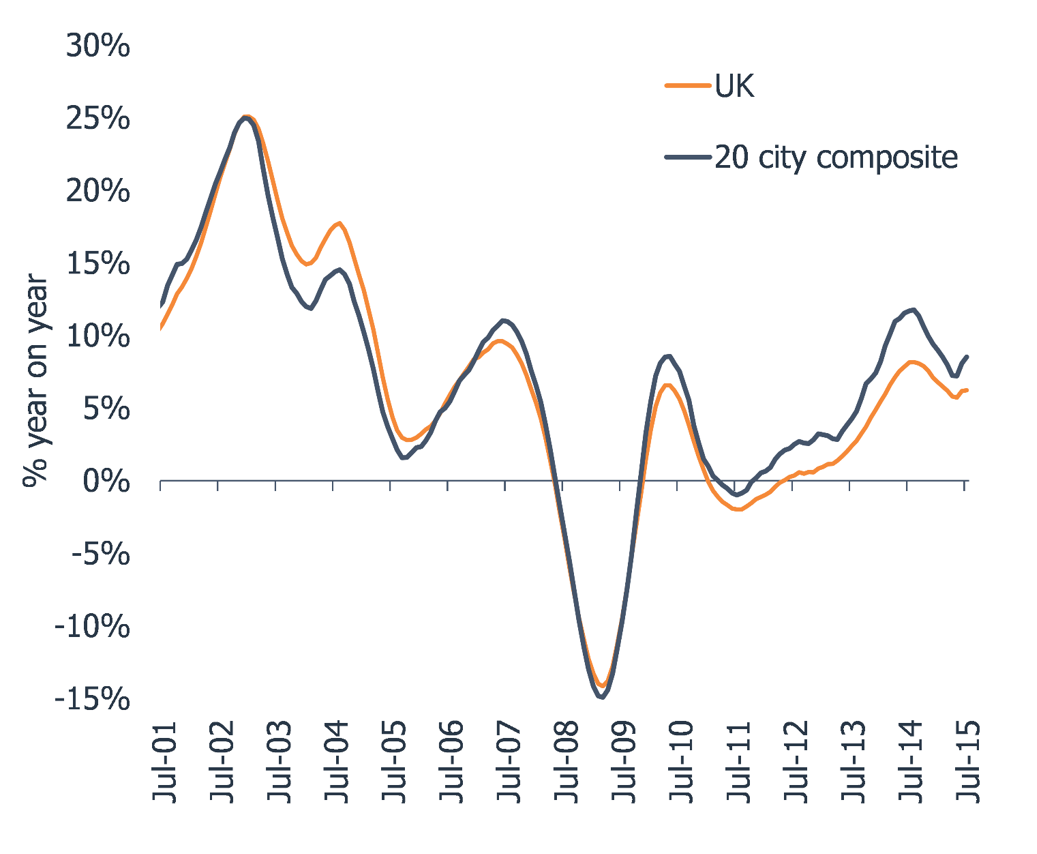
London, 21 August 2015 – Annual house price inflation across the Hometrack UK Cities House Price Index is accelerating as demand for housing continues to outstrip supply. The latest index shows that city level house price inflation running at 8.5% in July compared to 7.2% in April. House prices are up by 4.3% in the last three months – the highest quarterly growth for 11 years. This upward momentum in house prices comes on the back of a 32% increase in transaction volumes since April 2015 – mortgage lending for home purchase has grown 26% over the same period.
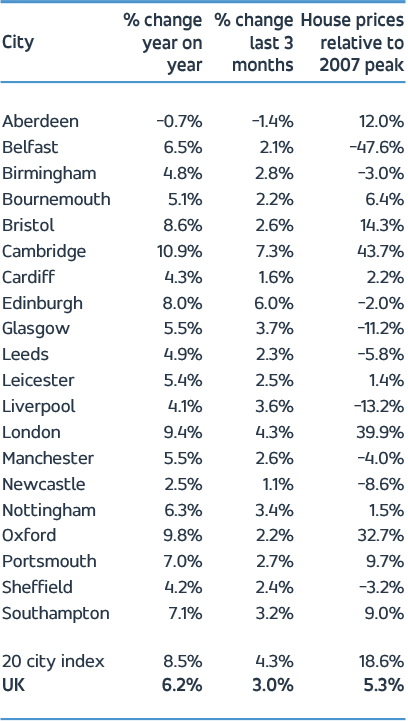
Table 1- UK 20 city index summary, July 2015

Source: Hometrack House Price Indices
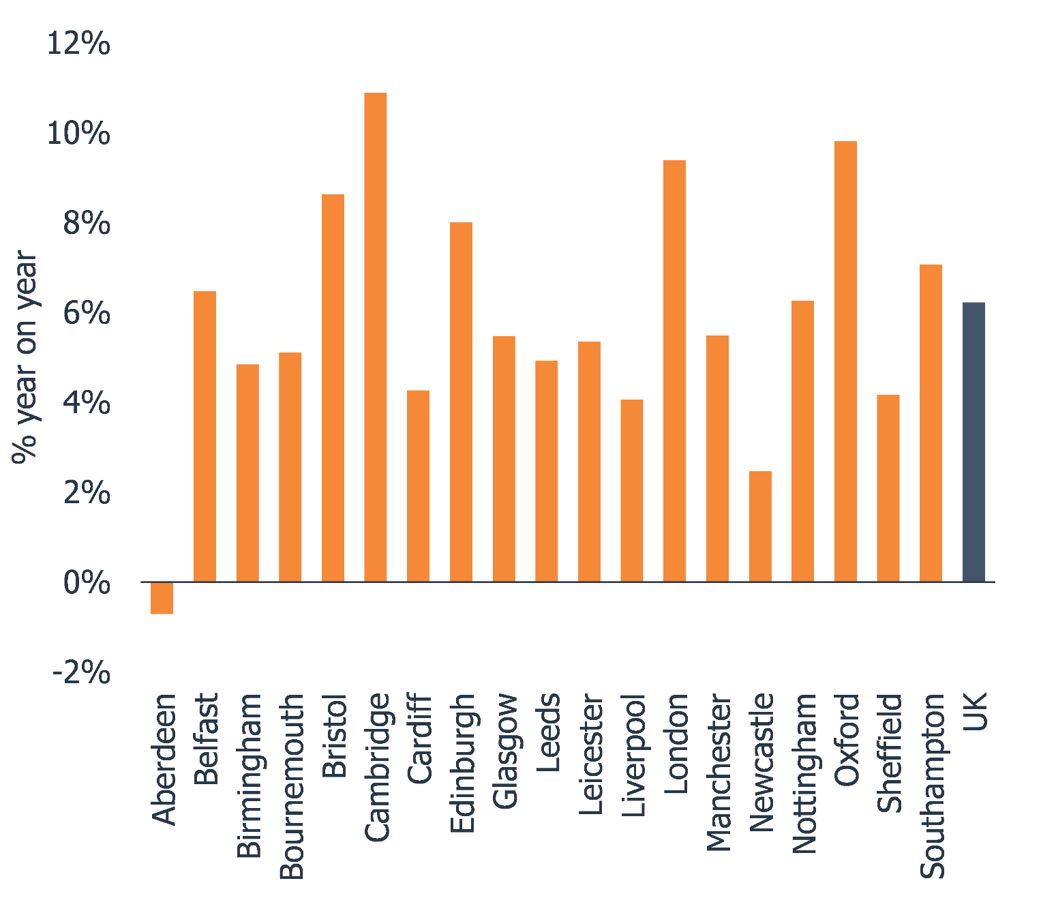
All cities with the exception of Aberdeen are registering house price growth ahead of annual growth in average earnings (currently 2.4%). The highest year on year growth is 10.9% in Cambridge followed by Oxford, London and Bristol. The lowest growth rate is being registered in Aberdeen (-0.7%).
Chart 1 - 3 month house price growth

Source: Hometrack House Price Indices
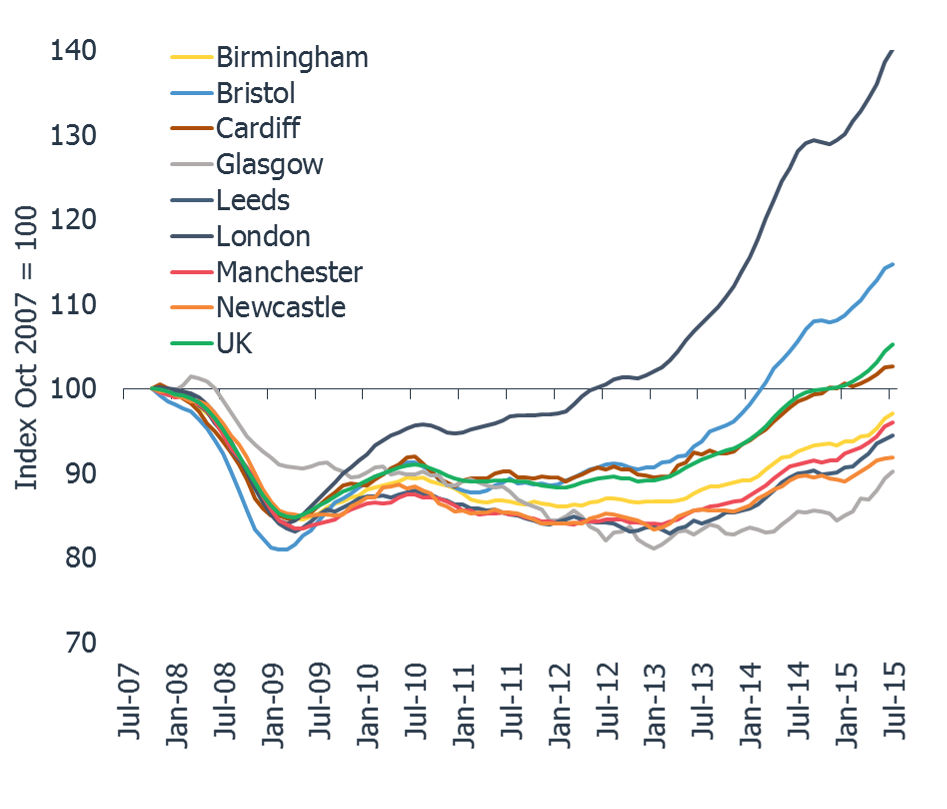
There is room for further catch-up in city level house prices. Nine of the twenty cities still have average prices that are lower than 2007 levels although this gap is narrowing rapidly.
Richard Donnell, Director of Research at residential analysts Hometrack, said:
“There remains further upside for city level house prices over the remainder of 2015. Low mortgage rates, economic growth and rising earnings will continue to stimulate demand and put an upward pressure on prices. As an international city, London is out on its own setting new highs for prices and affordability. How long this can be sustained is down to the prospects for the different segments of demand, specifically international buyers, domestic investors and domestic home owners. Overall city level house price inflation remains on track for 10% growth in 2015."
The Hometrack UK Cities House Price Index is Not Seasonally Adjusted
NOTE – The definition of London ‘City’ is larger than the London Government Region. The ‘City definition extends further out into London’s travel to work area capturing the commuter areas outside the 33 London Boroughs. The London ‘City’ area covers 44 local authorities and better represents the housing markets that are influenced by the London economy.
-ENDS-
About the Hometrack UK Cities House Price Index
The new Hometrack UK Cities House Price index has been designed to provide a granular analysis of housing market trends at a city level – cities are the focus for economic and demographic change as well as a focus for greater cross-area collaboration. The 20 cities in this new house price index cover a land area that is less than 5% of the UK but the cities contain over 40% of the value of UK housing and a similar proportion of all UK jobs. (See notes for more information on the index series.)
NOTES FOR EDITORS
1. Hometrack’s house price indices (HPI) are designed to track, as closely as possible, the performance of UK residential capital values over time. We have a track record of developing and running proprietary, localised, sub-regional house price indices for over a decade. Localised house price indices form a key part of the Hometrack automated valuation model where indexation is a key element of the valuation system. This valuation system is trusted by 4 of the top 5 lenders in the UK.
2. From October 2014, we are publishing a unique index based on 20 UK cities. We will also be producing indexes for the UK, Government Regions and the countries of Scotland, Wales and Northern Ireland. Interactive analysis, further information and FAQs on the index can be found at www.hometrack.com.
3. This new Hometrack UK Cities House Price Index is very different to our historic monthly housing survey which was an aggregation of the views of a large sample of agents and surveyors on key market trends in their local area. The survey has been dis-continued. Selected market metrics from the survey are being calculated from listings data and are available in Hometrack products and services.
4. The geographic definition of a city is based upon Primary Urban Areas – these cover the built up area of a city or a city region. Primary Urban Areas for English cities were defined in a report published by Government entitled The State of the English Cities Volume 1, ODPM, 2006. All cities are based upon amalgamations of single or multiple local authorities. The Primary Urban Area methodology has been applied to major cities across the rest of the UK covering Scotland, Wales and Northern Ireland.
5. Hometrack’s UK Cities House Price Index is created using a repeat sales based methodology drawing upon a large database comprising 100% of recorded sales prices from the Land Registry ‘Price Paid’ dataset and equivalent data from the Registers of Scotland. This price paid data is supplemented by mortgage valuation data.
6. The Hometrack UK Cities House Price Index is weighted according to the volume of private housing stock in each geographic area. The property type weightings are adjusted dynamically over time each quarter as the stock of housing grows, but the absolute changes are small.
7. The primary output of the UK Cities House Price Index build process is a monthly ‘multiplier’, the amount by which house prices have changed over the period based on the available evidence for the relevant geography. This monthly multiplier is used to create an index of house prices.
8. The Hometrack UK Cities House Price Index is revisionary i.e. there are revisions each month as more data comes available as sales are registered and further information becomes available. All UK house price indices are published on a revisionary basis. The scale of monthly revisions tends to be larger for smaller geographies where sales volumes are lower and indices can be more volatile at the leading edge. The historic revisions are minimal for the largest geographies.
9. The series are supplied on a non-seasonally adjusted basis.
10. In order to calculate the average price, the monthly price changes are applied to an average price to create a time series for average house prices from a base date which was in December 2013.
11. All average prices and percentage changes are expressed in nominal terms i.e. not adjusted for inflation.
12. Further information can be found at ww.hometrack.com
The latest Hometrack UK Cities Index reveals that in the three months to September house price inflation in London recorded the lowest quarterly growth for 20 months.
The latest Hometrack UK Cities Index reveals house price growth has fallen to 8.2% as the slowdown seen in cities across the south of England in recent months intensified in August.
London, Tuesday 13th September: Hometrack has been appointed by digital challenger bank, Atom, to provide a range of Automated Valuation Model (AVM) services.
The latest Hometrack UK Cities House Price Index reveals a marked slowdown in house price growth over the last three months, led by a deceleration in London and other high value cities across the south of England.

Subscribe to receive email updates.
HometrackGlobal:
Linked In: