Confirming payment details

Payment processing
Login or Sign up
Forgot password
Enter your email address and we will send you a password reset link or need more help?
UK Cities see fastest quarterly house price growth for 12 years as investors rush to beat stamp duty deadline
On 22 April, 2016- Latest Hometrack UK Cities House Price Index saw prices rise 4.2% in Q1 2016
- Highest quarterly increase seen in Liverpool where recovery has been slowest
- Tougher lending criteria and tax changes push investors into higher yielding lower priced markets
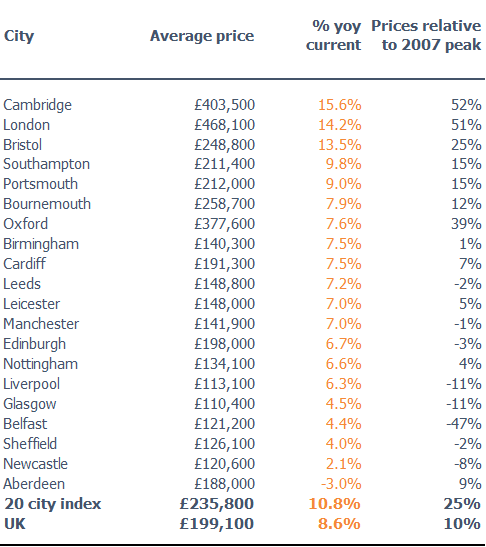
- Year on year growth across UK Cities is running at 10.8%, ahead of the 8.7% reported across the rest of the UK
The latest Hometrack UK Cities House Price Index reveals that city level house price inflation over the first three months of 2016 reached 4.2%, the highest rate of quarterly growth for 12 years as the normal seasonal increase in demand was boosted by demand from investors ahead of changes to stamp duty.
Tougher lending criteria for buy to let investors and changes to tax relief on mortgage interest payments have pushed investors to search for higher yielding property which means more investment in lower value cities, with lower buying costs, and further support for continued house price growth.
Year on year house price growth across UK Cities reached 10.8% outstripping the 8.7% reported across the rest of the UK. The highest increase in the last quarter was recorded in Liverpool as prices rose off a low base and closed the gap to other major cities such as Manchester and Leeds where house price growth is running at over 7% per annum - the highest year on year growth since 2007.
Richard Donnell, Insight Director at Hometrack says:
“The acceleration in growth in the last quarter has, in part, been down to stronger demand from investors, especially those searching for higher yielding property and seeking to beat the stamp duty deadline. With that deadline now passed, the question is how weaker investor demand will impact house price inflation in the second quarter of 2016. Especially at a time when home buyers start to consider the implications of the EU referendum for the economy and mortgage rates.”
Donnell concludes:
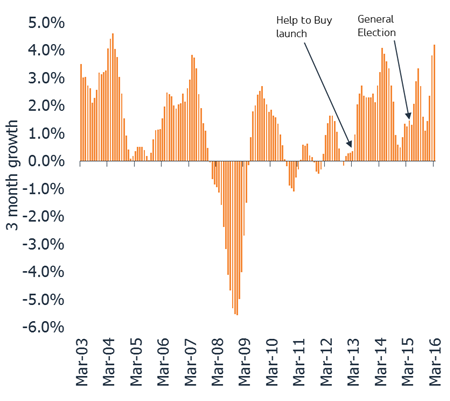
In the recent past, periods of accelerating house price growth have coincided with changes in market sentiment and demand notably following the introduction of Help to buy in 2013 and after the 2015 General Election. We believe house prices will continue to rise but a moderation in investor demand and greater caution in the run up to the EU referendum will limit further acceleration in prices. Most likely the rate of growth will slow more rapidly in high value, low yielding cities such as London where prices will be more responsive to weaker investor demand.”
The Hometrack UK Cities House Price Index is Not Seasonally Adjusted
NOTE – The definition of London ‘City’ is larger than the London Government Region. The ‘City definition extends further out into London’s travel to work area capturing the commuter areas outside the 33 London Boroughs. The London ‘City’ area covers 44 local authorities and better represents the housing markets that are influenced by the London economy.
-ENDS-
About the Hometrack UK Cities House Price Index
The new Hometrack UK Cities House Price index has been designed to provide a granular analysis of housing market trends at a city level – cities are the focus for economic and demographic change as well as a focus for greater cross-area collaboration. The 20 cities in this new house price index cover a land area that is less than 5% of the UK but the cities contain over 40% of the value of UK housing and a similar proportion of all UK jobs. (See notes for more information on the index series.)
NOTES FOR EDITORS
1. Hometrack’s house price indices (HPI) are designed to track, as closely as possible, the performance of UK residential capital values over time. We have a track record of developing and running proprietary, localised, sub-regional house price indices for over a decade. Localised house price indices form a key part of the Hometrack automated valuation model where indexation is a key element of the valuation system. This valuation system is trusted by 4 of the top 5 lenders in the UK.
2. From October 2014, we are publishing a unique index based on 20 UK cities. We will also be producing indexes for the UK, Government Regions and the countries of Scotland, Wales and Northern Ireland. Interactive analysis, further information and FAQs on the index can be found at www.hometrack.com.
3. This new Hometrack UK Cities House Price Index is very different to our historic monthly housing survey which was an aggregation of the views of a large sample of agents and surveyors on key market trends in their local area. The survey has been dis-continued. Selected market metrics from the survey are being calculated from listings data and are available in Hometrack products and services.
4. The geographic definition of a city is based upon Primary Urban Areas – these cover the built up area of a city or a city region. Primary Urban Areas for English cities were defined in a report published by Government entitled The State of the English Cities Volume 1, ODPM, 2006. All cities are based upon amalgamations of single or multiple local authorities. The Primary Urban Area methodology has been applied to major cities across the rest of the UK covering Scotland, Wales and Northern Ireland.
5. Hometrack’s UK Cities House Price Index is created using a repeat sales based methodology drawing upon a large database comprising 100% of recorded sales prices from the Land Registry ‘Price Paid’ dataset and equivalent data from the Registers of Scotland. This price paid data is supplemented by mortgage valuation data.
6. The Hometrack UK Cities House Price Index is weighted according to the volume of private housing stock in each geographic area. The property type weightings are adjusted dynamically over time each quarter as the stock of housing grows, but the absolute changes are small.
7. The primary output of the UK Cities House Price Index build process is a monthly ‘multiplier’, the amount by which house prices have changed over the period based on the available evidence for the relevant geography. This monthly multiplier is used to create an index of house prices.
8. The Hometrack UK Cities House Price Index is revisionary i.e. there are revisions each month as more data comes available as sales are registered and further information becomes available. All UK house price indices are published on a revisionary basis. The scale of monthly revisions tends to be larger for smaller geographies where sales volumes are lower and indices can be more volatile at the leading edge. The historic revisions are minimal for the largest geographies.
9. The series are supplied on a non-seasonally adjusted basis.
10. In order to calculate the average price, the monthly price changes are applied to an average price to create a time series for average house prices from a base date which was in December 2013.
11. All average prices and percentage changes are expressed in nominal terms i.e. not adjusted for inflation.
12. Further information can be found at ww.hometrack.com
The latest Hometrack UK Cities Index reveals that in the three months to September house price inflation in London recorded the lowest quarterly growth for 20 months.
The latest Hometrack UK Cities Index reveals house price growth has fallen to 8.2% as the slowdown seen in cities across the south of England in recent months intensified in August.
London, Tuesday 13th September: Hometrack has been appointed by digital challenger bank, Atom, to provide a range of Automated Valuation Model (AVM) services.
The latest Hometrack UK Cities House Price Index reveals a marked slowdown in house price growth over the last three months, led by a deceleration in London and other high value cities across the south of England.

Subscribe to receive email updates.
HometrackGlobal:
Linked In: