Confirming payment details

Payment processing
Login or Sign up
Forgot password
Enter your email address and we will send you a password reset link or need more help?
November 2014 - Hometrack UK Cities House Price Index released
On 19 December, 2014- UK house prices have risen by 8.9% year-on-year, but the rate of house price growth in the last quarter has slowed across 16 of the 20 cities
- House price inflation in London (0.5%) posted the same average growth as Manchester, Portsmouth and Belfast this quarter
- The greatest reversal was seen in Aberdeen (-0.4%) and Cambridge (-0.2%), but Oxford (0.3%), Cardiff (0.2%) and Bournemouth (0.1%) also showed pronounced slowdowns
- Scottish cities bounced back as Edinburgh (1.8%) and Glasgow (0.9%) continue to register above average rates of growth, as demand feeds back into the market post-referendum
- Hometrack are forecasting UK house price growth of +2% over 2015
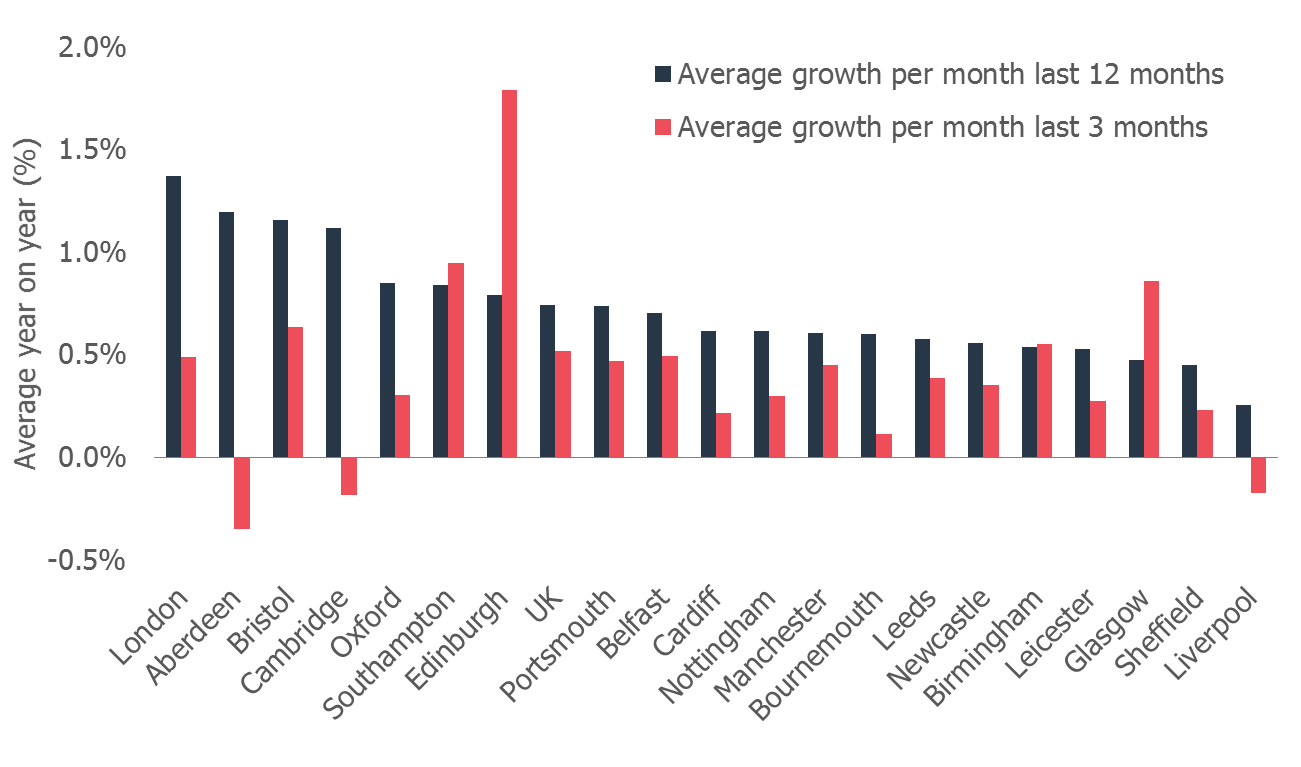
London lags behind five UK cities as the Capital’s house price growth drops by two-thirds in just three months.
London, 19 December 2014 – UK house prices have increased by 8.9% year-on-year but there has been a continued slowdown in the monthly rate of growth in recent months, Hometrack has revealed in its latest UK Cities House Price Index. The rate of house price growth in London slowed by two-thirds in the last quarter compared to the 12 month average (0.5% compared to 1.4%) with Edinburgh, Glasgow, Southampton, Bristol and Birmingham now all registering higher inflation than the Capital in the last 3 months as demand for housing continues to push prices ahead. This growth is being supported by the fact that house prices are still rising off a low base in many cities.
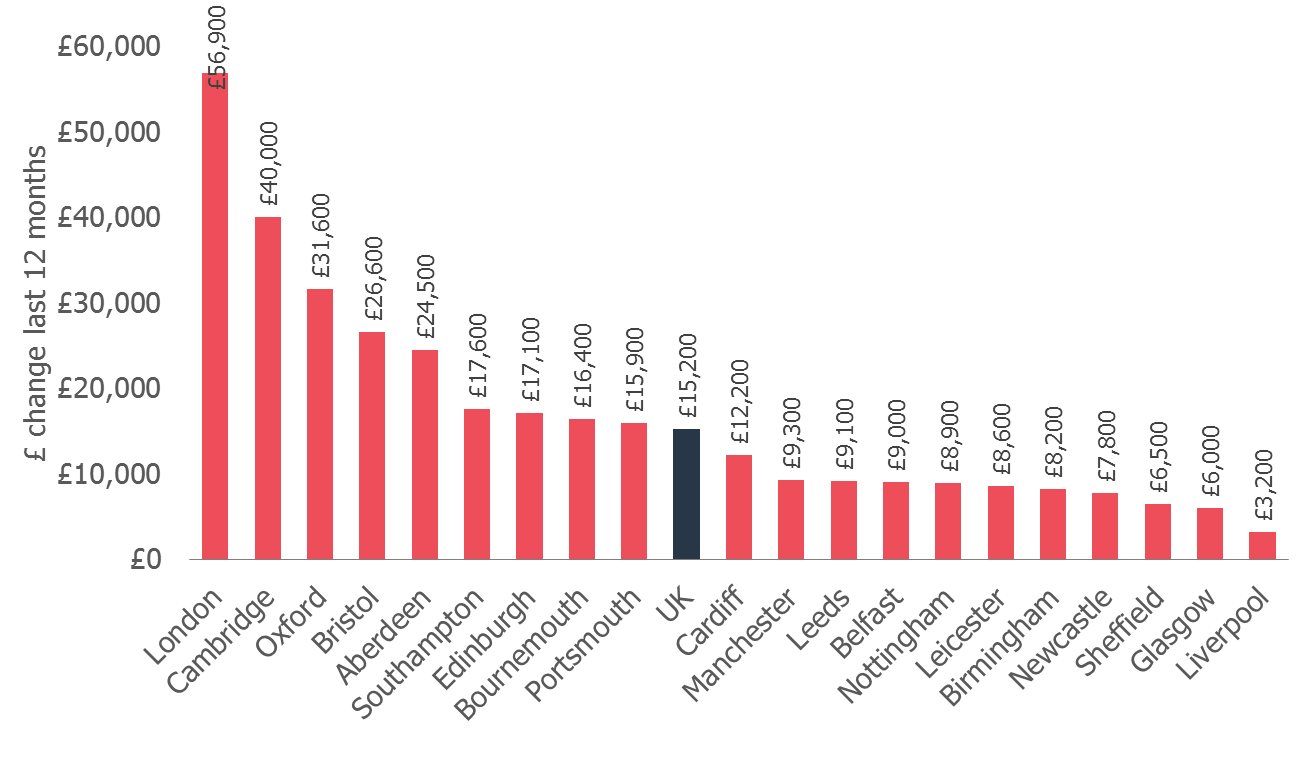
House prices are above their 2007 peak in eight cities with London (30.5%), Cambridge (28.7%) and Oxford (21.9%) leading the pack but these markets are starting to register the clearest slowdown. This translated to an average annual increase in London property values of £57,000, which is nearly four times the national average of £15,200 and almost twice the UK’s average income. Liverpool recorded the lowest increase in values with just £3,000 added to house prices in the last year.
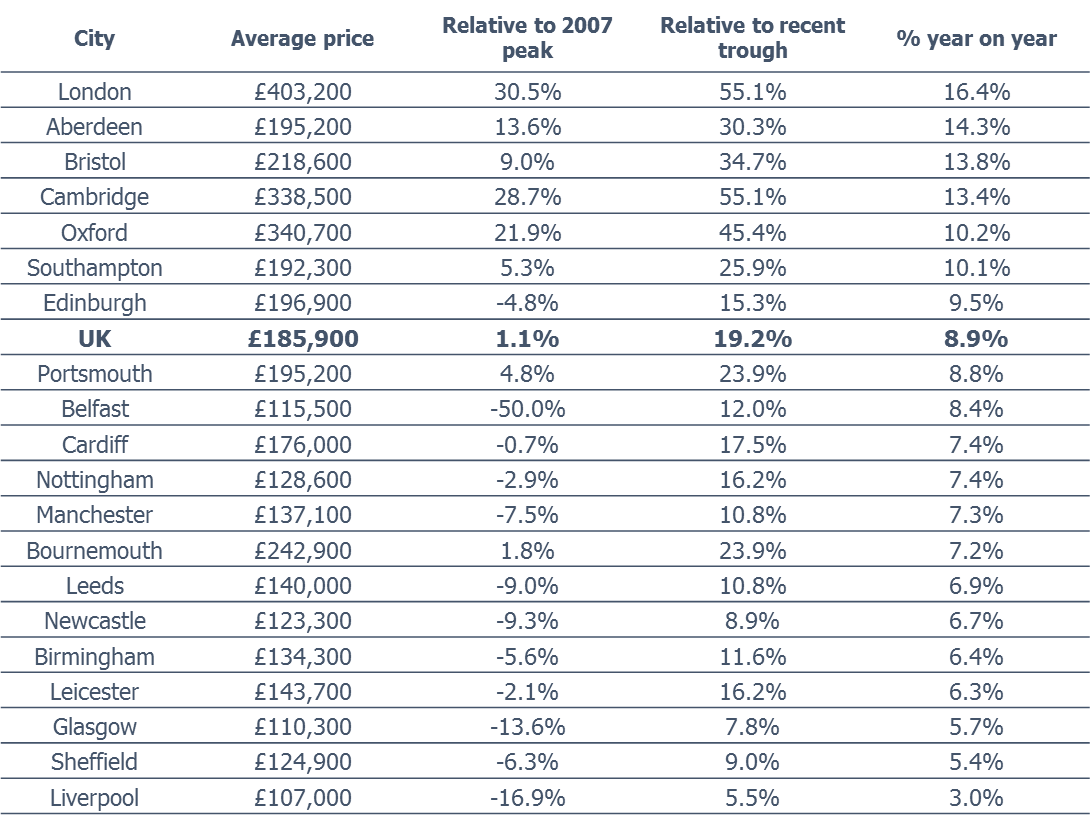
The Scottish cities of Edinburgh (1.8%) and Glasgow (0.9%) registered the fastest house price inflation in the last quarter, as demand fed back into the market post-referendum. In a reversal of fortune, the former high growth cities of Cambridge and Aberdeen have seen the fastest slowdown with growth of -0.2% and -0.4% respectively.
Richard Donnell, Research Director, Hometrack, said: “The high growth cities over the last year are now recording the fastest slowdown and this is most pronounced in smaller cities such as Cambridge and Aberdeen. The Aberdeen economy is closely related to the health of the oil industry and a weakening oil price is impacting the housing market. The slowdown in London, which we identified in, will act as a drag on the UK rate of house price growth over the next 12 months. The rate of growth in house prices is starting to lose momentum across other cities in southern England, while across the rest of the country modest levels of house price appreciation continue as prices rise off a low base.
“Overall we expect modest UK house price growth of 2% in 2015, which is more in line with earnings growth. Significant pent-up demand has feed back into the market in the last two years pushing house prices higher in all cities but the underlying rate of growth is now slowing across the majority of markets.
“The introduction of mortgage market affordability tests in the middle of 2014 has reduced the overall impact of low mortgage rates on house prices. A return to more modest rates of growth should be welcomed especially by the Bank of England. The ongoing heath of the housing market is now about the extent to which the growth in the economy feeds into continued growth in incomes and employment.
“Whilst there are only isolated price falls city level, there is clear evidence of more localised price falls starting to emerge with, for example 20% of London postcodes registering price falls in the last quarter. We would expect to see further, modest price falls the months ahead as prices re-align off a high base to what buyers are prepared to pay. Changes in demand can feed quickly into prices as we have seen in the last 18 months but it is important to remember the equation works in both directions.”
Five cities registered faster growth than London in the last quarter – Edinburgh, Glasgow, Southampton, Bristol and Birmingham
The Hometrack UK Cities House Price Index is Not Seasonally Adjusted
NOTE – The definition of London ‘City’ is larger than the London Government Region. The ‘City definition extends further out into London’s travel to work area capturing the commuter areas outside the 33 London Boroughs. The London ‘City’ area covers 44 local authorities and better represents the housing markets that are influenced by the London economy.
-ENDS-
About the Hometrack UK Cities House Price Index
The new Hometrack UK Cities House Price index has been designed to provide a granular analysis of housing market trends at a city level – cities are the focus for economic and demographic change as well as a focus for greater cross-area collaboration. The 20 cities in this new house price index cover a land area that is less than 5% of the UK but the cities contain over 40% of the value of UK housing and a similar proportion of all UK jobs. (See notes for more information on the index series.)
NOTES FOR EDITORS
1. Hometrack’s house price indices (HPI) are designed to track, as closely as possible, the performance of UK residential capital values over time. We have a track record of developing and running proprietary, localised, sub-regional house price indices for over a decade. Localised house price indices form a key part of the Hometrack automated valuation model where indexation is a key element of the valuation system. This valuation system is trusted by 4 of the top 5 lenders in the UK.
2. From October 2014, we are publishing a unique index based on 20 UK cities. We will also be producing indexes for the UK, Government Regions and the countries of Scotland, Wales and Northern Ireland. Interactive analysis, further information and FAQs on the index can be found at www.hometrack.com.
3. This new Hometrack UK Cities House Price Index is very different to our historic monthly housing survey which was an aggregation of the views of a large sample of agents and surveyors on key market trends in their local area. The survey has been dis-continued. Selected market metrics from the survey are being calculated from listings data and are available in Hometrack products and services.
4. The geographic definition of a city is based upon Primary Urban Areas – these cover the built up area of a city or a city region. Primary Urban Areas for English cities were defined in a report published by Government entitled The State of the English Cities Volume 1, ODPM, 2006. All cities are based upon amalgamations of single or multiple local authorities. The Primary Urban Area methodology has been applied to major cities across the rest of the UK covering Scotland, Wales and Northern Ireland.
5. Hometrack’s UK Cities House Price Index is created using a repeat sales based methodology drawing upon a large database comprising 100% of recorded sales prices from the Land Registry ‘Price Paid’ dataset and equivalent data from the Registers of Scotland. This price paid data is supplemented by mortgage valuation data.
6. The Hometrack UK Cities House Price Index is weighted according to the volume of private housing stock in each geographic area. The property type weightings are adjusted dynamically over time each quarter as the stock of housing grows, but the absolute changes are small.
7. The primary output of the UK Cities House Price Index build process is a monthly ‘multiplier’, the amount by which house prices have changed over the period based on the available evidence for the relevant geography. This monthly multiplier is used to create an index of house prices.
8. The Hometrack UK Cities House Price Index is revisionary i.e. there are revisions each month as more data comes available as sales are registered and further information becomes available. All UK house price indices are published on a revisionary basis. The scale of monthly revisions tends to be larger for smaller geographies where sales volumes are lower and indices can be more volatile at the leading edge. The historic revisions are minimal for the largest geographies.
9. The series are supplied on a non-seasonally adjusted basis.
10. In order to calculate the average price, the monthly price changes are applied to an average price to create a time series for average house prices from a base date which was in December 2013.
11. All average prices and percentage changes are expressed in nominal terms i.e. not adjusted for inflation.
12. Further information can be found at ww.hometrack.com
The latest Hometrack UK Cities Index reveals that in the three months to September house price inflation in London recorded the lowest quarterly growth for 20 months.
The latest Hometrack UK Cities Index reveals house price growth has fallen to 8.2% as the slowdown seen in cities across the south of England in recent months intensified in August.
London, Tuesday 13th September: Hometrack has been appointed by digital challenger bank, Atom, to provide a range of Automated Valuation Model (AVM) services.
The latest Hometrack UK Cities House Price Index reveals a marked slowdown in house price growth over the last three months, led by a deceleration in London and other high value cities across the south of England.

Subscribe to receive email updates.
HometrackGlobal:
Linked In: