Confirming payment details

Payment processing
Login or Sign up
Forgot password
Enter your email address and we will send you a password reset link or need more help?
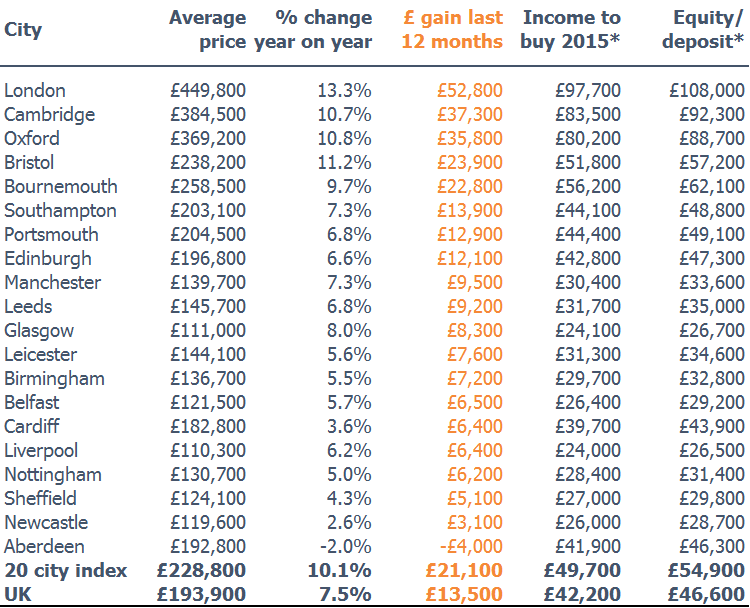
November 2015 UK Cities Index - City level house price inflation hits 10% growth in 2015 with London growing fastest by an average of £52,900
On 18 December, 2015- The fastest rate of growth in the 12 months to November has been registered in London at 13.3% (14.7% in 2014) where the average price has increased by £52,900 over the year
- The average income to afford a home in a UK city with an average 76% mortgage at a 3.5x income mortgage is £49,700, up from £45,200 a year ago
- Scarcity and low turnover of stock will remain features of market supporting price growth but at expense of greater risk of localised price volatility, especially in cities with stretched affordability
- The weakest rate of growth has been recorded in Aberdeen where average house prices have fallen by 2.0% after a 12% increase in 2014
- The city with the strongest turnaround over the last 12 months has been Glasgow where growth has jumped from 1.8% a year ago to 8.0% today as prices recover off a low base in one of the most affordable cities covered by the index.
City level house price inflation is now running in double digits once again at 10.1% but transaction volumes for the year as a whole look set to be 5% lower as fewer homes come to the market for sale causing scarcity of supply
London, 18 December 2015 – Hometrack’s UK Cities House Price Index has recorded annual house price growth 10.1% per annum. This double digit growth has been driven by a chronic shortage of homes for sale particularly in the latter half of 2015 which is reflected in the 5% drop in open market transaction volumes.
Moving amongst existing mortgage homeowners accounted for the lowest share of housing sales in a decade (33% compared to 50% in 2007).This group are a vital source of new supply alongside new homes which account for 10% of sales a year. Strong demand from investors, most of whom are not sellers, has also exacerbated the erosion of available supply.
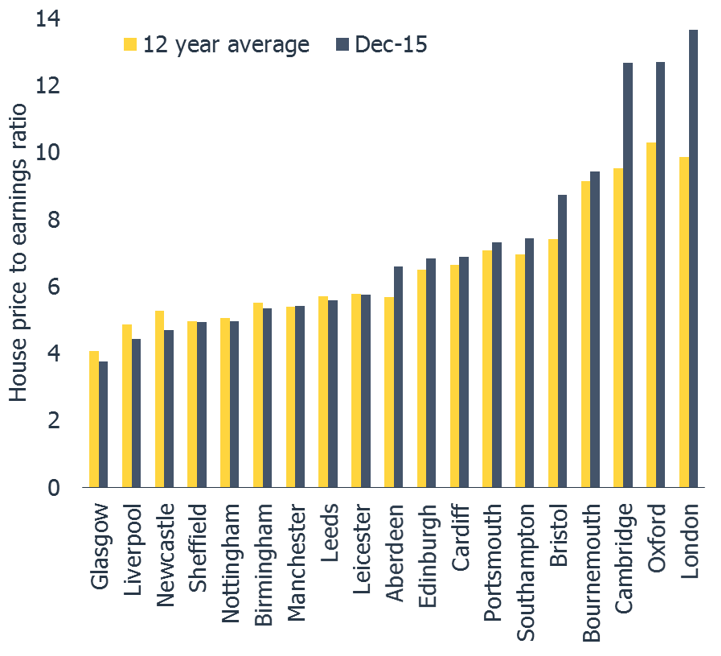
The real engine for house price growth in 2016 looks set to come from regional cities which have recorded much lower levels of house price growth in the last few years and affordability levels are far less stretched. House price to earnings ratios are well ahead of the long run average in London, Oxford and Cambridge yet across all other cities affordability on this measure is in line with the average over the last 12 years. Across the 20 cities covered by the index the average income to afford a home with an average 76% mortgage at a 3.5x income mortgage is £49,700, up from £45,200 a year ago
While the average mortgage rate is at an all-time low of 2.6% the reality is that existing mortgaged home owners outside the south east seem reluctant to take on debt to bid up the cost of housing. Debt servicing costs continue to fall with the average mortgage rate on outstanding mortgage debt down to just 3.1%. UK households have seen interest payments fall by a further £1.1bn over 2015.
The recent policy interventions are set to have a mixed impact on the market. Investor demand is set to weaken over the course of 2016 as a result of stamp duty and tax relief changes announced earlier in the year. The tax relief changes are likely to result in some modest dis-investment as investors de-leverage their portfolio. Despite these changes, private investors will remain an important feature of the housing market but scale growth in investor demand will slow in 2016.
Looking ahead to 2016 Richard Donnell, Director of Research, Hometrack, said:
“The scarcity of homes for sale looks set to remain a feature of the market in 2016. This will only ease once we see greater levels of output from home builders and renewed activity amongst the 8m existing mortgaged home owners.
“Questions over the sustainability of house price growth are being raised as house prices accelerate on growing scarcity and lower sales volumes, especially in the high growth markets such as London. The greatest focus is on the influence of investor buyers, who we estimate account for one in every five buyers nationally. This group don’t need to buy homes and could react differently to home owners in the face of changing market or economic conditions.
“Assuming the first interest rate rise is in the second half of 2016 then we expect 7% growth in city level house prices over 2016 with housing transactions broadly flat. This is based on a slowdown in growth across London as affordability pressures and lower investor demand ease the upward pressure on house prices. Earlier and faster rate rises than those assumed by the market would reduce the scale of house price growth as they would further impact investor demand and mortgage affordability.”
The Hometrack UK Cities House Price Index is Not Seasonally Adjusted
NOTE – The definition of London ‘City’ is larger than the London Government Region. The ‘City definition extends further out into London’s travel to work area capturing the commuter areas outside the 33 London Boroughs. The London ‘City’ area covers 44 local authorities and better represents the housing markets that are influenced by the London economy.
-ENDS-
About the Hometrack UK Cities House Price Index
The new Hometrack UK Cities House Price index has been designed to provide a granular analysis of housing market trends at a city level – cities are the focus for economic and demographic change as well as a focus for greater cross-area collaboration. The 20 cities in this new house price index cover a land area that is less than 5% of the UK but the cities contain over 40% of the value of UK housing and a similar proportion of all UK jobs. (See notes for more information on the index series.)
NOTES FOR EDITORS
1. Hometrack’s house price indices (HPI) are designed to track, as closely as possible, the performance of UK residential capital values over time. We have a track record of developing and running proprietary, localised, sub-regional house price indices for over a decade. Localised house price indices form a key part of the Hometrack automated valuation model where indexation is a key element of the valuation system. This valuation system is trusted by 4 of the top 5 lenders in the UK.
2. From October 2014, we are publishing a unique index based on 20 UK cities. We will also be producing indexes for the UK, Government Regions and the countries of Scotland, Wales and Northern Ireland. Interactive analysis, further information and FAQs on the index can be found at www.hometrack.com.
3. This new Hometrack UK Cities House Price Index is very different to our historic monthly housing survey which was an aggregation of the views of a large sample of agents and surveyors on key market trends in their local area. The survey has been dis-continued. Selected market metrics from the survey are being calculated from listings data and are available in Hometrack products and services.
4. The geographic definition of a city is based upon Primary Urban Areas – these cover the built up area of a city or a city region. Primary Urban Areas for English cities were defined in a report published by Government entitled The State of the English Cities Volume 1, ODPM, 2006. All cities are based upon amalgamations of single or multiple local authorities. The Primary Urban Area methodology has been applied to major cities across the rest of the UK covering Scotland, Wales and Northern Ireland.
5. Hometrack’s UK Cities House Price Index is created using a repeat sales based methodology drawing upon a large database comprising 100% of recorded sales prices from the Land Registry ‘Price Paid’ dataset and equivalent data from the Registers of Scotland. This price paid data is supplemented by mortgage valuation data.
6. The Hometrack UK Cities House Price Index is weighted according to the volume of private housing stock in each geographic area. The property type weightings are adjusted dynamically over time each quarter as the stock of housing grows, but the absolute changes are small.
7. The primary output of the UK Cities House Price Index build process is a monthly ‘multiplier’, the amount by which house prices have changed over the period based on the available evidence for the relevant geography. This monthly multiplier is used to create an index of house prices.
8. The Hometrack UK Cities House Price Index is revisionary i.e. there are revisions each month as more data comes available as sales are registered and further information becomes available. All UK house price indices are published on a revisionary basis. The scale of monthly revisions tends to be larger for smaller geographies where sales volumes are lower and indices can be more volatile at the leading edge. The historic revisions are minimal for the largest geographies.
9. The series are supplied on a non-seasonally adjusted basis.
10. In order to calculate the average price, the monthly price changes are applied to an average price to create a time series for average house prices from a base date which was in December 2013.
11. All average prices and percentage changes are expressed in nominal terms i.e. not adjusted for inflation.
12. Further information can be found at ww.hometrack.com
The latest Hometrack UK Cities Index reveals that in the three months to September house price inflation in London recorded the lowest quarterly growth for 20 months.
The latest Hometrack UK Cities Index reveals house price growth has fallen to 8.2% as the slowdown seen in cities across the south of England in recent months intensified in August.
London, Tuesday 13th September: Hometrack has been appointed by digital challenger bank, Atom, to provide a range of Automated Valuation Model (AVM) services.
The latest Hometrack UK Cities House Price Index reveals a marked slowdown in house price growth over the last three months, led by a deceleration in London and other high value cities across the south of England.

Subscribe to receive email updates.
HometrackGlobal:
Linked In: