Confirming payment details

Payment processing
Login or Sign up
Forgot password
Enter your email address and we will send you a password reset link or need more help?
October 2014 - Hometrack UK Cities House Price Index
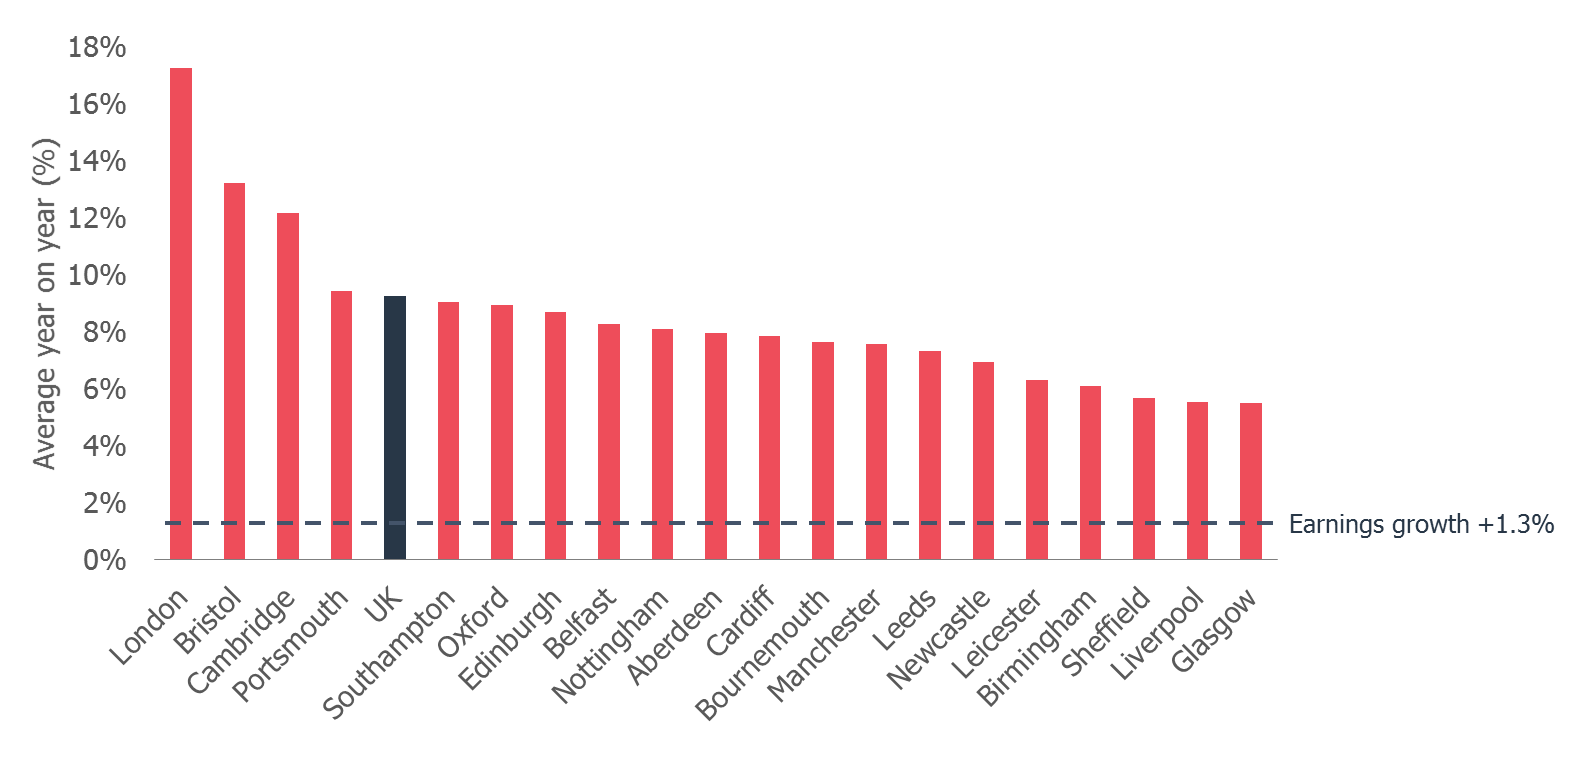
On 21 November, 2014- 14 of the 20 cities are now registering house price inflation below the national average for the UK, with 13 cities recording a deceleration in growth compared with 10 the previous month
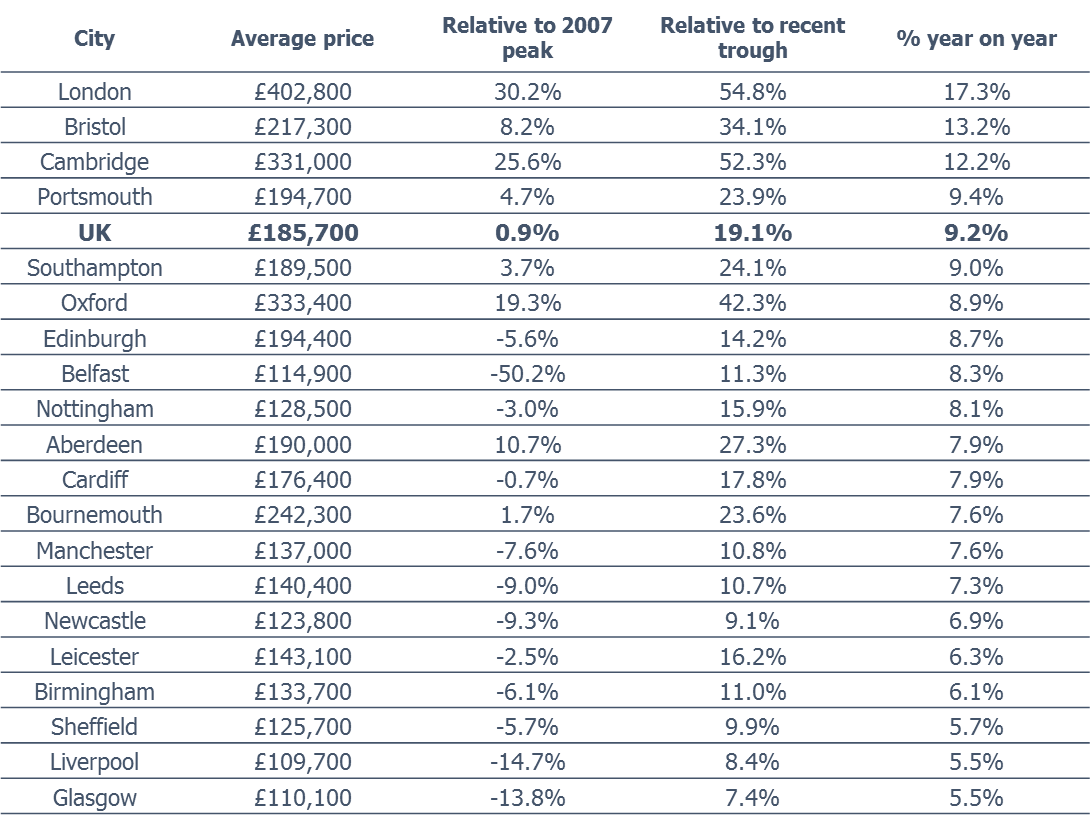
- The three cities with the highest house price growth year-on-year are London (17.3%), Bristol (13.2%) and Cambridge (12.2%) although momentum in these markets is slowing
- The lowest house price growth was recorded in Glasgow (5.5%) and Liverpool (5.5%), but these cities are continuing to see an acceleration in the rate of growth albeit off a low base
Top 20 UK cities all registering annual house price growth of 5% or more for the first time in a decade as housing recovery spreads
London, 21 November 2014 – The growth in house prices continues to spread across the UK. All the UK’s top 20 cities are registering annual house price growth of over five per cent for the first time since November 2004, Hometrack has revealed in its latest UK Cities House Price Index. This is more than three-times the current growth in average UK earnings (1.3 per cent), as pent up demand has fed back into the market supported by low mortgage rates and a pick-up in the economy.
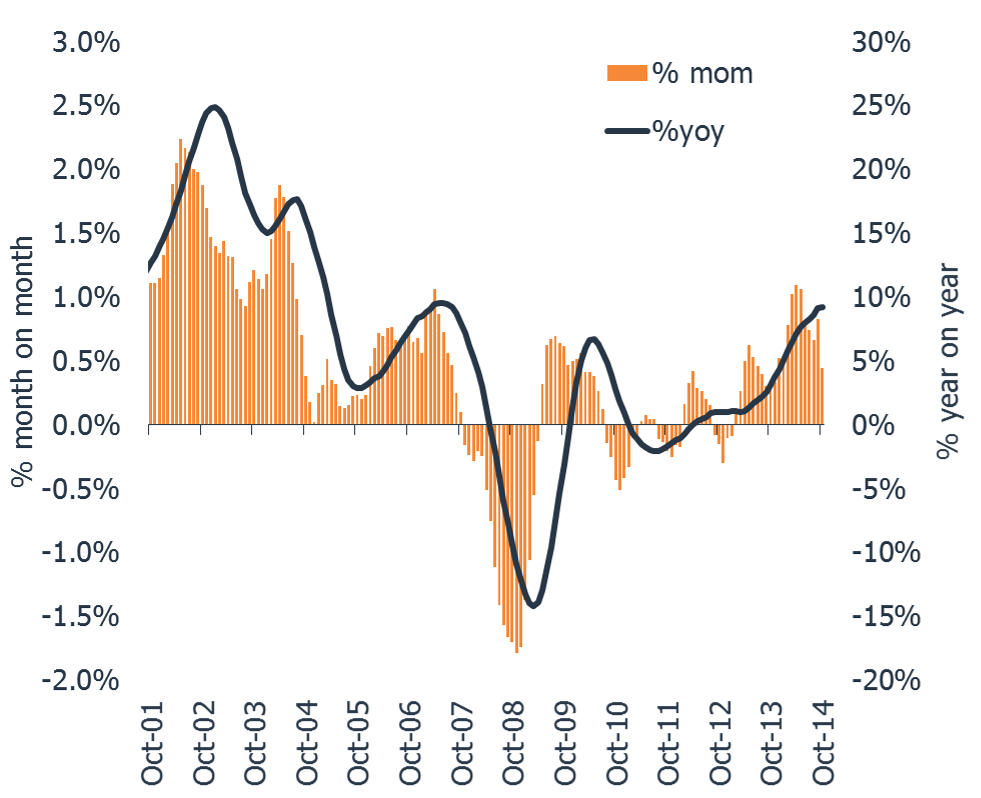
However, there is clear evidence that the upward pressure on house price is starting to slow on weaker demand for housing. In the last three months average UK house prices have grown by 0.6% per month compared to 1.1% in the three months to May 2014. The majority of cities are now starting to show signs of a deceleration in the underlying rate of growth but cities with the lowest growth in Spring 2014 - Glasgow, Edinburgh and Newcastle – have recorded an acceleration as house prices rise off a low base.
This latest analysis shows that eleven cities have an average house price below that of the UK with Liverpool and Glasgow house prices 41% lower than the UK average. London bucks the trend with an average house price of more than double that of the UK at 117%, illustrating how the capital dominates the rest of the country and is distorting the national picture.
The Cities Index also showed a post-referendum bounce in house prices in Edinburgh and Glasgow as confidence improves with average prices up 4.1% and 2.2% respectively in the last quarter, although the market in Aberdeen (-2.0% in last quarter) – the other Scottish city included in the report – is being impacted by a weak oil price with prices declining off a high base. Oxford and Cambridge have seen average prices come off the boil quite sharply in the last three months (-1.2% and -2.3% respectively) with house prices starting to fall back after very strong gains of 42% and 52% in the last 4 years - these smaller cities are seeing pricing levels respond more quickly to weaker demand.
Richard Donnell, Research Director, Hometrack, said:
“The pick-up in house prices that started 2 years ago has spread across all the cities of the UK with growth ranging from 5.5% in Liverpool and Glasgow to 18% in London. This latest analysis shows that momentum in house price increases is starting to slow with less pent-up demand for housing than two years ago. While mortgage rates remain low, new mortgage affordability tests and loan to income caps are impacting on the ability of marginal buyers to access the market, especially in the higher value markets such as London. On top of this, concerns over the impact of the global economy on the UK’s economic outlook are likely to come more to the fore.
“Despite the economic uncertainty, the slowdown in the UK housing market will be welcome news for policy makers who want to avoid a debt fuelled acceleration in house prices supported by record low mortgage rates. We expect the rate of house price growth to slow further in the run up to the year end.
“However, there are still bright spots of activity amid reports of a wider national slowdown. For the first time since the financial crisis, an improved economic outlook has seen house prices in cities outside the south of England rising off a low base. By the end of the year, we could well see monthly house price growth in London slipping below that of some of major cities outside the south east.”
Hometrack’s UK Cities House Price Index reveals upward momentum in prices is slowing with growth in the last quarter almost half that seen in the Spring.
The Hometrack UK Cities House Price Index is Not Seasonally Adjusted
NOTE – The definition of London ‘City’ is larger than the London Government Region. The ‘City definition extends further out into London’s travel to work area capturing the commuter areas outside the 33 London Boroughs. The London ‘City’ area covers 44 local authorities and better represents the housing markets that are influenced by the London economy.
Graph 3 – City House Price as a % of the UK Average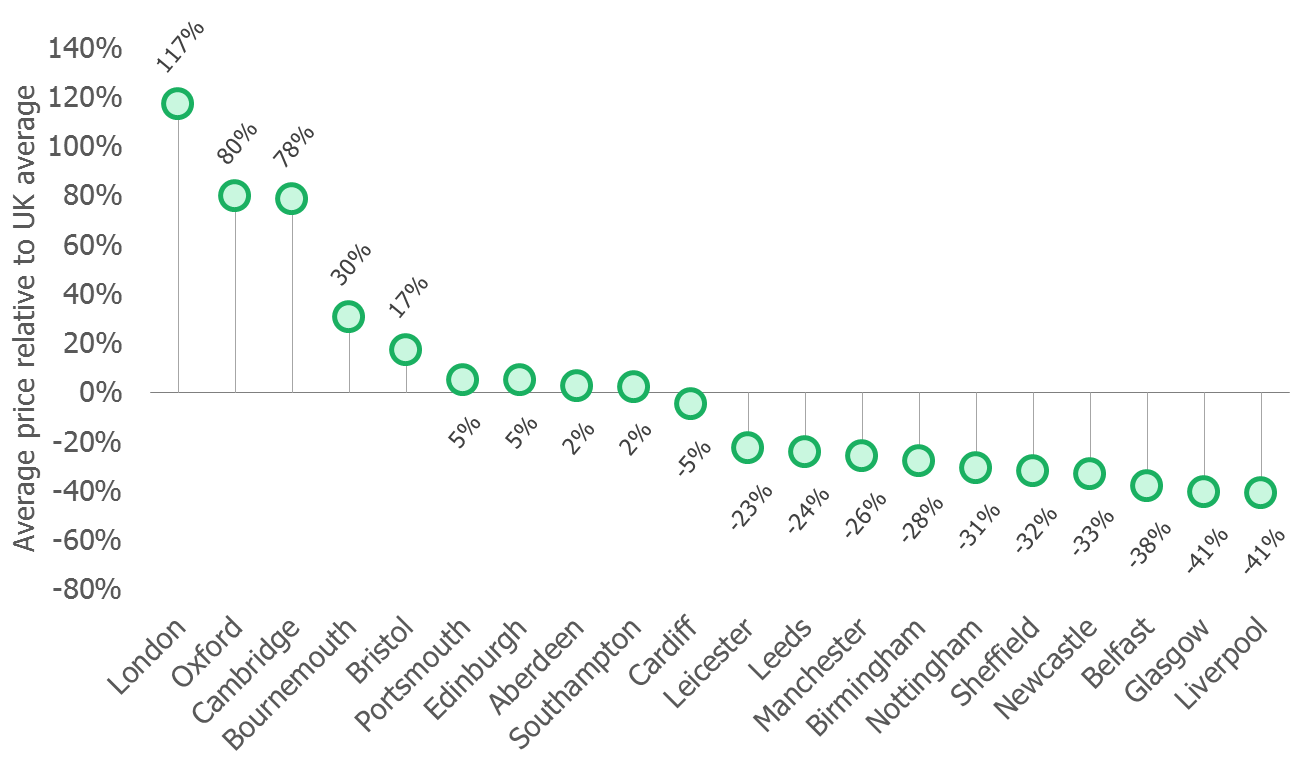
About the Hometrack UK Cities House Price Index
The new Hometrack UK Cities House Price index has been designed to provide a granular analysis of housing market trends at a city level – cities are the focus for economic and demographic change as well as a focus for greater cross-area collaboration. The 20 cities in this new house price index cover a land area that is less than 5% of the UK but the cities contain over 40% of the value of UK housing and a similar proportion of all UK jobs. (See notes for more information on the index series.)
NOTES FOR EDITORS
1. Hometrack’s house price indices (HPI) are designed to track, as closely as possible, the performance of UK residential capital values over time. We have a track record of developing and running proprietary, localised, sub-regional house price indices for over a decade. Localised house price indices form a key part of the Hometrack automated valuation model where indexation is a key element of the valuation system. This valuation system is trusted by 4 of the top 5 lenders in the UK.
2. From October 2014, we are publishing a unique index based on 20 UK cities. We will also be producing indexes for the UK, Government Regions and the countries of Scotland, Wales and Northern Ireland. Interactive analysis, further information and FAQs on the index can be found at www.hometrack.com.
3. This new Hometrack UK Cities House Price Index is very different to our historic monthly housing survey which was an aggregation of the views of a large sample of agents and surveyors on key market trends in their local area. The survey has been dis-continued. Selected market metrics from the survey are being calculated from listings data and are available in Hometrack products and services.
4. The geographic definition of a city is based upon Primary Urban Areas – these cover the built up area of a city or a city region. Primary Urban Areas for English cities were defined in a report published by Government entitled The State of the English Cities Volume 1, ODPM, 2006. All cities are based upon amalgamations of single or multiple local authorities. The Primary Urban Area methodology has been applied to major cities across the rest of the UK covering Scotland, Wales and Northern Ireland.
5. Hometrack’s UK Cities House Price Index is created using a repeat sales based methodology drawing upon a large database comprising 100% of recorded sales prices from the Land Registry ‘Price Paid’ dataset and equivalent data from the Registers of Scotland. This price paid data is supplemented by mortgage valuation data.
6. The Hometrack UK Cities House Price Index is weighted according to the volume of private housing stock in each geographic area. The property type weightings are adjusted dynamically over time each quarter as the stock of housing grows, but the absolute changes are small.
7. The primary output of the UK Cities House Price Index build process is a monthly ‘multiplier’, the amount by which house prices have changed over the period based on the available evidence for the relevant geography. This monthly multiplier is used to create an index of house prices.
8. The Hometrack UK Cities House Price Index is revisionary i.e. there are revisions each month as more data comes available as sales are registered and further information becomes available. All UK house price indices are published on a revisionary basis. The scale of monthly revisions tends to be larger for smaller geographies where sales volumes are lower and indices can be more volatile at the leading edge. The historic revisions are minimal for the largest geographies.
9. The series are supplied on a non-seasonally adjusted basis.
10. In order to calculate the average price, the monthly price changes are applied to an average price to create a time series for average house prices from a base date which was in December 2013.
11. All average prices and percentage changes are expressed in nominal terms i.e. not adjusted for inflation.
12. Further information can be found at ww.hometrack.com
The latest Hometrack UK Cities Index reveals that in the three months to September house price inflation in London recorded the lowest quarterly growth for 20 months.
The latest Hometrack UK Cities Index reveals house price growth has fallen to 8.2% as the slowdown seen in cities across the south of England in recent months intensified in August.
London, Tuesday 13th September: Hometrack has been appointed by digital challenger bank, Atom, to provide a range of Automated Valuation Model (AVM) services.
The latest Hometrack UK Cities House Price Index reveals a marked slowdown in house price growth over the last three months, led by a deceleration in London and other high value cities across the south of England.

Subscribe to receive email updates.
HometrackGlobal:
Linked In: