Confirming payment details

Payment processing
Login or Sign up
Forgot password
Enter your email address and we will send you a password reset link or need more help?
September 2015 UK Cities Index - Pace of city level house price growth looks to have peaked, despite many having average house prices below the levels recorded in 2007
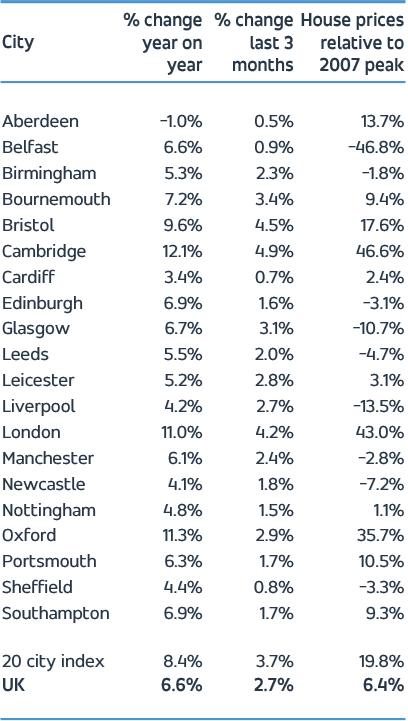
On 23 October, 2015- City level house price inflation is running at 8.4% per annum up from 6.6% in May
- Thirteen of the twenty cities have registered a slower rate of growth in Q3 compared to Q2
- The pace of house price growth is expected to slow in Q4 as seasonal factors kick in
- There is a 3% average discount between asking and achieved prices across English cities
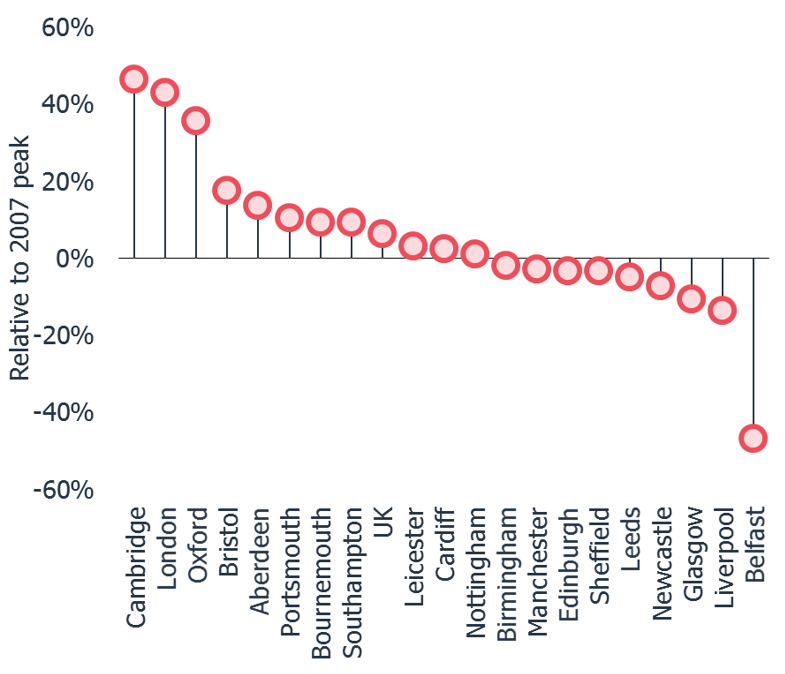
- City level house price growth is running ahead of earnings, but average house prices remain below the levels recorded in 2007 in nine cities.
There are signs that the underlying rate of house price growth has peaked, as thirteen of the twenty cities tracked by the Hometrack Cities Index have registered a slower rate of growth post-election
London, 23 October 2015 – There are signs that the underlying rate of growth in house prices may have peaked, according to Hometrack’s UK Cities House Price Index, despite average prices remaining below the levels recorded in 2007 in nine cities.
While city level house price inflation is running at 8.4% per annum compared to 6.6% in May, the year on year rate of house price growth masks more volatility in the underlying rate of growth. The three month rate of growth expressed on an annualised basis appears to have plateaued. This is in part due to seasonal factors, as well as mortgage approvals increasing over June and July and then falling by almost 20% in August.
Thirteen of the twenty cities monitored by the Cities Index registered a slower rate of growth in Q3 of 2015 compared to Q2.
City level house price growth is still running ahead of earnings and the UK as a whole. Average house prices are below the levels recorded eight years ago in nine cities with Belfast still 46% lower than in 2007 followed by Liverpool where prices are still 14% lower over the same period.
The outlook for housing demand remains positive against the backdrop of lower mortgage rates and rising consumer confidence however the latest mortgage data raises questions over whether the rate of growth since the May 2015 election can be sustained. Demand is expected to moderate in Q4 of 2015, with a modest slowdown in the pace of house price growth likely in the run up to the year end.
Richard Donnell, Director of Research at residential analysts Hometrack, said:
“It is important not to read too much into one month’s headline results but there are signs that the pace of city level house price growth is likely to continue slowing. There has been a surge of demand since the election in May but weaker mortgage approvals and evidence from survey data suggests less frenetic demand in the final quarter of the year.
“Putting the relative performance of UK cities into wider perspective shows a wide variation in performance from city to city emphasising that there is no single UK housing market – house prices in Belfast prices still remain almost half the level seen in 2007 while those in London are 43% higher. The variation in growth reflects the strength of underlying demand for housing and the health of the local economy with the index throwing light on these localised trends at a granular level.”
The Hometrack UK Cities House Price Index is Not Seasonally Adjusted
NOTE – The definition of London ‘City’ is larger than the London Government Region. The ‘City definition extends further out into London’s travel to work area capturing the commuter areas outside the 33 London Boroughs. The London ‘City’ area covers 44 local authorities and better represents the housing markets that are influenced by the London economy.
-ENDS-
About the Hometrack UK Cities House Price Index
The new Hometrack UK Cities House Price index has been designed to provide a granular analysis of housing market trends at a city level – cities are the focus for economic and demographic change as well as a focus for greater cross-area collaboration. The 20 cities in this new house price index cover a land area that is less than 5% of the UK but the cities contain over 40% of the value of UK housing and a similar proportion of all UK jobs. (See notes for more information on the index series.)
NOTES FOR EDITORS
1. Hometrack’s house price indices (HPI) are designed to track, as closely as possible, the performance of UK residential capital values over time. We have a track record of developing and running proprietary, localised, sub-regional house price indices for over a decade. Localised house price indices form a key part of the Hometrack automated valuation model where indexation is a key element of the valuation system. This valuation system is trusted by 4 of the top 5 lenders in the UK.
2. From October 2014, we are publishing a unique index based on 20 UK cities. We will also be producing indexes for the UK, Government Regions and the countries of Scotland, Wales and Northern Ireland. Interactive analysis, further information and FAQs on the index can be found at www.hometrack.com.
3. This new Hometrack UK Cities House Price Index is very different to our historic monthly housing survey which was an aggregation of the views of a large sample of agents and surveyors on key market trends in their local area. The survey has been dis-continued. Selected market metrics from the survey are being calculated from listings data and are available in Hometrack products and services.
4. The geographic definition of a city is based upon Primary Urban Areas – these cover the built up area of a city or a city region. Primary Urban Areas for English cities were defined in a report published by Government entitled The State of the English Cities Volume 1, ODPM, 2006. All cities are based upon amalgamations of single or multiple local authorities. The Primary Urban Area methodology has been applied to major cities across the rest of the UK covering Scotland, Wales and Northern Ireland.
5. Hometrack’s UK Cities House Price Index is created using a repeat sales based methodology drawing upon a large database comprising 100% of recorded sales prices from the Land Registry ‘Price Paid’ dataset and equivalent data from the Registers of Scotland. This price paid data is supplemented by mortgage valuation data.
6. The Hometrack UK Cities House Price Index is weighted according to the volume of private housing stock in each geographic area. The property type weightings are adjusted dynamically over time each quarter as the stock of housing grows, but the absolute changes are small.
7. The primary output of the UK Cities House Price Index build process is a monthly ‘multiplier’, the amount by which house prices have changed over the period based on the available evidence for the relevant geography. This monthly multiplier is used to create an index of house prices.
8. The Hometrack UK Cities House Price Index is revisionary i.e. there are revisions each month as more data comes available as sales are registered and further information becomes available. All UK house price indices are published on a revisionary basis. The scale of monthly revisions tends to be larger for smaller geographies where sales volumes are lower and indices can be more volatile at the leading edge. The historic revisions are minimal for the largest geographies.
9. The series are supplied on a non-seasonally adjusted basis.
10. In order to calculate the average price, the monthly price changes are applied to an average price to create a time series for average house prices from a base date which was in December 2013.
11. All average prices and percentage changes are expressed in nominal terms i.e. not adjusted for inflation.
12. Further information can be found at ww.hometrack.com
The latest Hometrack UK Cities Index reveals that in the three months to September house price inflation in London recorded the lowest quarterly growth for 20 months.
The latest Hometrack UK Cities Index reveals house price growth has fallen to 8.2% as the slowdown seen in cities across the south of England in recent months intensified in August.
London, Tuesday 13th September: Hometrack has been appointed by digital challenger bank, Atom, to provide a range of Automated Valuation Model (AVM) services.
The latest Hometrack UK Cities House Price Index reveals a marked slowdown in house price growth over the last three months, led by a deceleration in London and other high value cities across the south of England.

Subscribe to receive email updates.
HometrackGlobal:
Linked In: