Confirming payment details

Payment processing
Login or Sign up
Forgot password
Enter your email address and we will send you a password reset link or need more help?
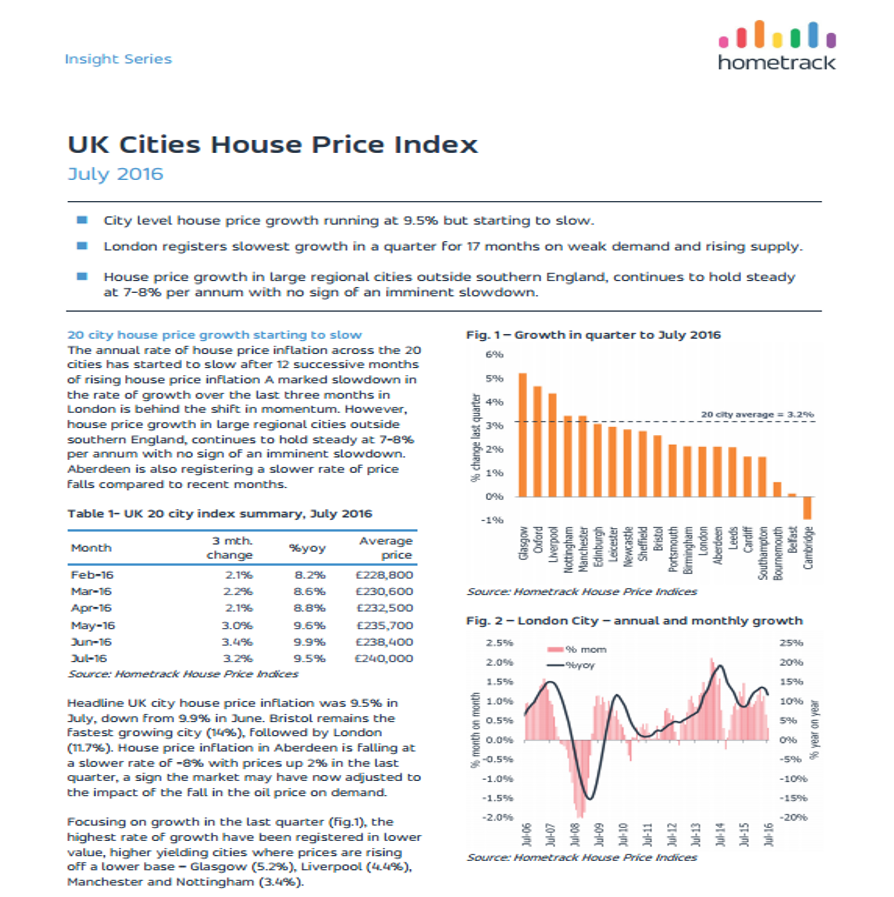
July 2016 - 20 city house price growth starting to slow
On 26 August, 2016- City level house price growth running at 9.5% but starting to slow.
- London registers slowest growth in a quarter for 17 months on weak demand and rising supply.
- House price growth in large regional cities outside southern England, continues to hold steady at 7-8% per annum with no sign of an imminent slowdown.
The annual rate of house price inflation across the 20 cities has started to slow after 12 successive months of rising house price inflation A marked slowdown in the rate of growth over the last three months in London is behind the shift in momentum. However, house price growth in large regional cities outside southern England, continues to hold steady at 7-8% per annum with no sign of an imminent slowdown. Aberdeen is also registering a slower rate of price falls compared to recent months.
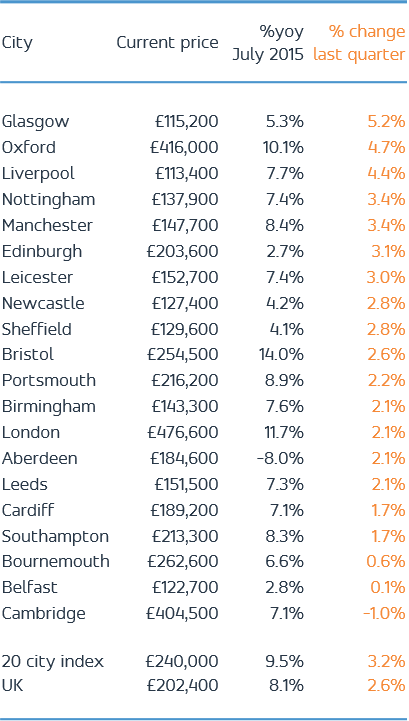
Headline UK city house price inflation was 9.5% in July, down from 9.9% in June. Bristol remains the fastest growing city (14%), followed by London (11.7%). House price inflation in Aberdeen is falling at a slower rate of -8% with prices up 2% in the last quarter, a sign the market may have now adjusted to the impact of the fall in the oil price on demand.
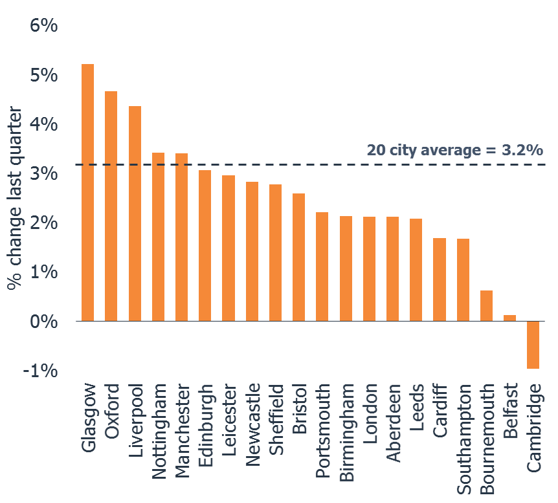
Focusing on growth in the last quarter (fig.1), the highest rate of growth have been registered in lower value, higher yielding cities where prices are rising off a lower base – Glasgow (5.2%), Liverpool (4.4%), Manchester and Nottingham (3.4%).
London and Cambridge losing momentum
London has registered a marked slowdown in house price growth over the last three months (fig.2). Average growth in the last quarter was 2.1%, the lowest rate for 17 months as weaker investor demand, affordability pressures and Brexit uncertainty impact demand at the same time as supply has risen. This is still an annualised rate of 8%+ but the signs are growth will slow further over the coming months. Cambridge posted a 1% price fall over the last quarter with prices more sensitive to weaker demand although the annual rate of growth is still running at 7.1%.
Large, regional cities show no sign of a slowdown
Outside southern England, large regional cities such as Leeds, Manchester, Birmingham and Cardiff are registering annual growth rates of 7-8% per annum. House price growth in the last quarter suggests no imminent slowdown with house price inflation stable for now.
What outlook for the rest of the year?
The latest official data from HMRC on housing sales to July show seasonally adjusted volumes down 8% year on year but data is limited as to how this plays out across cities. Update analysis of recent listings data suggests sales volumes are continuing to hold up outside London and southern England. The greatest divergence in new supply and sales remains in London, consistent with slower growth recorded by the Hometrack index.
In the absence of adverse economic trends impacting employment and mortgage rates, the near term outlook is for a continued slowdown in London towards mid-single digit growth and stable growth rates in regional cities as households’ price record low mortgage rates into city house price where affordability remains attractive.
We continue to believe that turnover will register the brunt of the slowdown in London. In the face of lower sales volumes agents will look to re-price stock in line with what buyers are prepared, and can afford, to pay. Past experience shows that this process can run for as long as 6 months and relies, in part, in how quickly sellers are willing to adjust to what buyers are prepared to pay.
Fig. 2 – London City – annual and monthly growth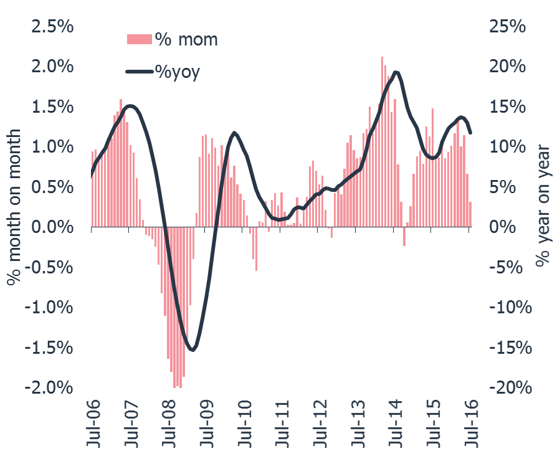
July 2016 - 20 city house price growth starting to slow
Related articles
City level house price growth is holding steady at 8.4%. This month we reveal an updated view on city level affordability. This finds that after an 86% uplift in house prices since 2009, the price to earnings ratio in London now sits above 14x with Oxford and Cambridge close behind. Other cities are at or below their long run average. Read the Report to find out what this means for city level house price inflation.
City level house price growth is running at 8.5% but growth in London has slowed rapidly in the last quarter to the lowest level of quarterly growth for 20 months. Eleven cities are registering higher growth than at the start of 2016 while 9 are slowing.
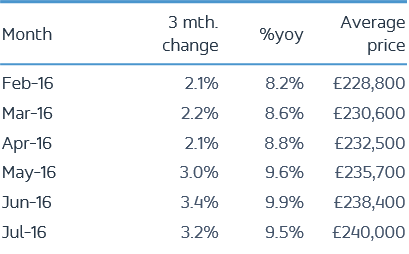
The pace of city level house price inflation is slowing with growth in the year to August 2016 running at 8.2%. The 20 city index recorded its lowest level of quarterly growth (1.9%) for 6 months as a seasonal lull in market activity and weaker demand post Brexit and the March Stamp Duty change reduce the upward momentum of house price growth
It is still very early days to assess the true impact of the EU referendum vote on activity and house prices. Hometrack's view, based on our Cities Index and analysis of listings data, remains that sales volumes are likely to slow and price growth will moderate over the second half of the year.

Subscribe to receive email updates.
HometrackGlobal:
Linked In: